May 07

Australia’s Dumb Budget

I don’t have a great deal to say other than I thought I’d take this opportunity to point out, again, that with Australia’s multi-speed economy there is absolutely no logic in having a budget surplus. The budget surplus has become a political football that is not based on logic but is based on some ridiculous perspective that a budget surplus iis what the public wants.

The reality is that there are numerous specific parts of the Australian that are not travelling so well. The high Australian dollar has resulted in weak tourism (Gold Cost, Sunshine Coast, Cairns etc are struggling), weak manufacturing, and weak performing retailers to say the least. The European situation has resulted in a financial services sector experiencing higher funding costs which in order to keep shareholders happy has resulted in thousands of job losses. On the other hand, the mining boom continues….its growth is slowing but its still strong and there are many people moving their careers to the resources sector.

This multi-speed, not so strong, economy requires multi-speed, strong targeted policy to ensure this current weakness doesn’t get worse…and that is only possible with fiscal policy. Monetary policy via the Reserve Bank’s interest rate adjustments is a blunt tool that cannot be specifically targeted to those who need it, particularly when banks decide not to pass on rate cuts.

The Keynes approach, which in this continuing global financial crisis is proving to be more spot on every day, is to save in the good times and spend in the tough times and right now there are many in Australia  who need a little bit of spending on them. Our government has very little debt and don’t let anyone fool you into thinking otherwise….besides, we even have our own currency that can depreciate to boost international investment should things go pear-shaped.

Anyway, assuming we all see the Australian government announce a budget that results in a budget surplus, don’t assume that is good budget but a dumb budget (and the opposition’s focus on a budget surplus should not be forgotten). There is no excuse for not helping those who need help.

Apr 30

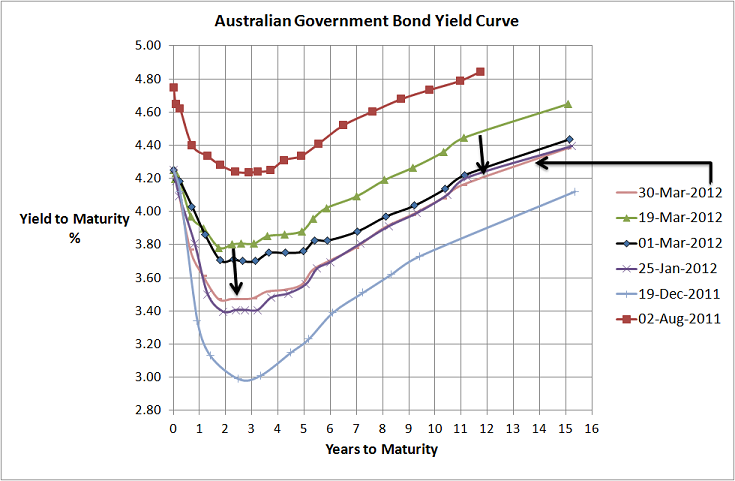
Australian Government Bond Yield Curve…new lows

Source: RBA

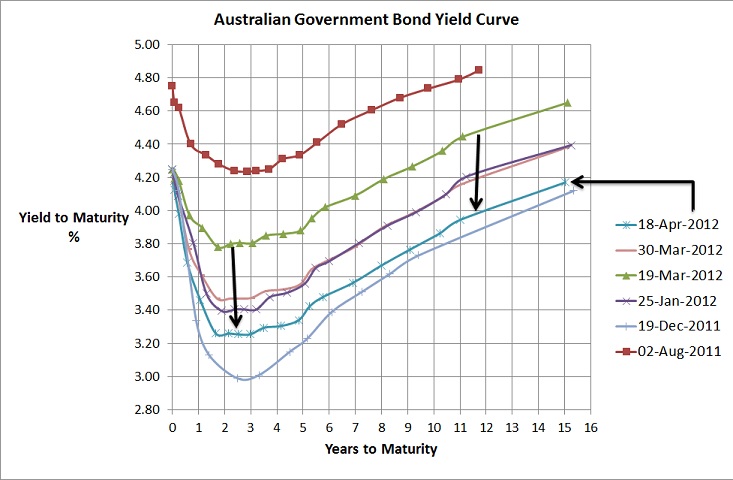
I know its just a week and a half since I last provided an Australian Government Bond Yield curve update but over this time the curve has dropped another 20-25bps to mostly be below the bottom from 19th December. This is largely on the back of weak inflation data…deflation if you look at the seasonally adjusted data…and other weak data from Europe and China.

All in all looks like this is the type of market signal that strongly reflects a very weak outlook for the Australian economywhich should guarantee a minimum of 25bps cut by the RBA tomorrow.


Apr 24

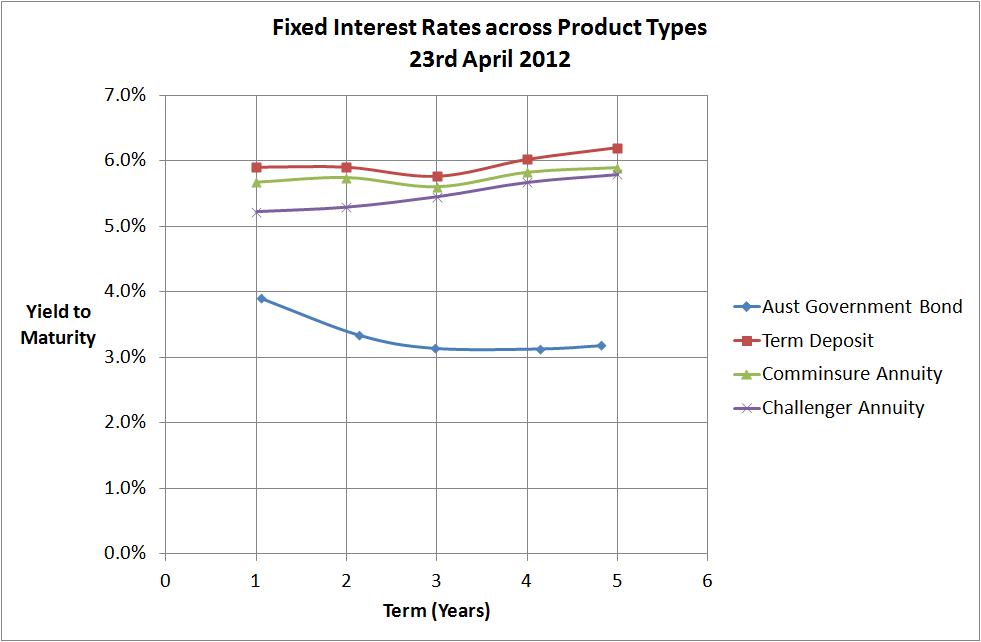
No wonder Term Deposits are popular…annuities too

Source: RBA, Comminsure, Challenger Life, RimSec

The above chart is pretty strong evidence as to why investors are placing their money into term deposits and annuities…very very attractive margins over government bonds. As you can see, at the 5 year term the interest rates for term deposits and annuities are almost double!

When you consider that between 1962 and 2011 the Australian sharemarket only outperformed Australian bonds by 2.8%pa, and that premium is almost built into Term Deposit and Annuity rates but without anywhere near the risk of the sharemarket…in fact term deposits are government guaranteed up to a value of $250,000 and APRA monitor the life companies to ensure they have sufficient capital to meet future obligations.

To the retail investor, the sharemarket is a very tough sell at the moment and particular whilst rates are where they are. The retail investor has capitulated on the sharemarket and it looks like it’ll be quite a while, i.e. years and years, before they’ll be back.

Apr 22

People appear to be choosing rent over property purchase

Following is a press release from SQM Research that was released last night. It pretty much says it all…residential vacancies relatively stable month on month and up a tiny bit year on year. Perth appears to be a rental concern with very few vacancies whilst Melbourne has the highest vacancy rate in Australia.

Figures released by SQM Research reveal that the level of residential vacancies remained relatively unchanged during the month of March 2012, increasing on a national level by only 243 vacancies. The national vacancy rate remained at 1.7%, revealing a 0.2% increase year-on-year.

It appears that Australia’s rental market is remaining excessively tight for the time being with no capital cities recording considerable increases month-on-month or recording a vacancy rate of 3% or higher.

With the housing market itself remaining sluggish, it is likely that more and more individuals are choosing the rental market over deciding to purchase property at this time. This continued negative sentiment when it comes to real estate is assumedly putting increased pressure on the nation’s vacancies.

Managing Director of SQM Research, Louis Christopher says, “Perth is now an area of major concern with vacancies now sitting at an incredibly low 0.5%. This is consistent with evidence from other researchers reporting rapidly rising rents.

“Hobart on the other hand is beginning to show signs of the opposite extreme, with vacancies doubling since this time last year and many localities recording vacancy rates above 4%. We are also seeing rising stock levels in this area, which in contrast to other capital cities which seem to suffer from one or the other, reveals that Hobart is being hit with an oversupply issue from both sides.”

SQM’s calculations of vacancies are based on online rental listings that have been advertised for three weeks or more compared to the total number of established rental properties. SQM considers this a superior methodology compared to using a potentially incomplete sample of agency surveys or merely relying on raw online listings advertised.

Key Points

  • Nationally, vacancies remained the same during the month of March, recording a vacancy rate of 1.7% and a total of 47, 323 vacancies.
  • Melbourne has recorded the highest vacancy rate of the capital cities- revealing a vacancy rate of 2.9% and a total of 10,738 vacancies.
  • Perth has recorded the tightest vacancy rate of the capital cities at 0.5% – a total of 936 vacancies.
  • Hobart has recorded the highest yearly growth in vacancies, increasing by 1.2% since March 2011 and coming to a total of 678 vacancies.
  •  Darwin has recorded the most extensive yearly falls, decreasing by 1.3% since March 2011 and coming to a total of 142 vacancies.
  • Adelaide, Canberra and Hobart all recorded monthly increases of 0.1%. Aside from this, there were no other increases for capital cities month on month.

Source: SQM Research

Apr 19

Australian Government Bond Yields…heading south again

Source: RBA

The above chart shows that bond yields shows that after bond yields reached a high around 1 month ago they have declined across all terms by around 50bps. That means that most of the traditional bond funds would have produced capital gains of around 2% over that last month (because the duration od the bond index is a little short of 4 and you multiply that by the yield curve change to get the approximate capital gain/loss)…definitely an excellent month for bond funds. The downside is that the yield curve has dropped because the economic outlook, once again, has taken a turn for the worst. Europe is starting to blow up again…Spanish 10 year bond yields have been hovering around 6% thanks to a nasty austerity package…and there’s also been some lower than expected Chinese GDP data (not that anyone’s every believed the numbers anyway) which has contributed to lower commodity prices.

These continue to be the two big issues for our economy, bond and equity markets; so what the future holds is anyone’s guess but as I’ve been blogging for a long long time, I’m very confident that markets will be volatile…oh yeah and the market is pretty confident cash interest rates are coming down and at least 50bps this year.

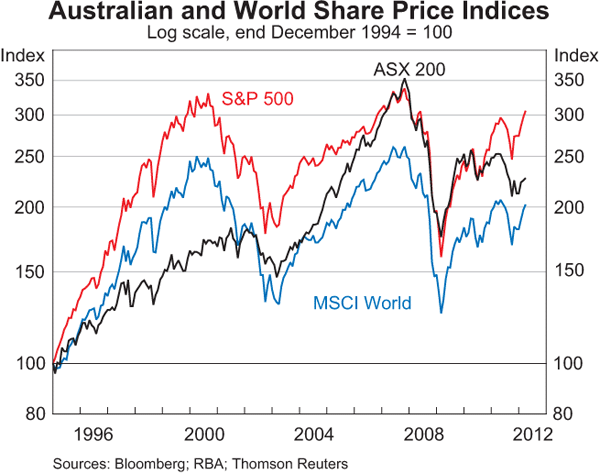
Now whilst I’ve just mentioned that China and Europe are likely the biggest impacts on our markets…as the below correlated chart shows…the direction in our market is unlikely to be too different to anyone elses.

Apr 16

Retirement Income Portfolios – poorly understood

One of the debates in the financial services media has been around the investment strategy of superannuation funds and whether they are holding too many equities. In the camp of too many equities is former Head of Treasury, Ken Henry, nd former Chairman of the Future Fund, David Murray; and opposing views have typically been valuation focused, which is not necessarily a bad thing, by fund managers. Whilst I believe this is a healthy debate and one that should have occurred many many years ago, one of the rarely spoken debates has been regarding retirement income portfolios. Unfortunately many retirees carry their ‘default’ super fund with them into retirement without any understanding of the potential inappropriateness of that portfolio. Some of the retirement income issues that need to be debated include…

  • Risks
  • Asset Allocation requirements
  • Product innovation

Risks

As opposed to accumulation stage, there are two major risks that are potentially far more damaging to the retirement income portfolio than an accumulation portfolio…

  1. Sequencing or timing risks
  2. Inflation risk

One of the world’s leading thinkers in retirement income portfolio construction is Moshe Milevsky who in his book, “Pensionise your Nest Egg”, is of the belief that the first 7 years of retirement is the most crucial period to determining whether portfolio lasts a lifetime. A sequence of negative returns can result in a dramatically changed lifestyle.

My own simulation studies also show the potential portfolio failure of a 5% drawdown growing at 3%pa has a probability of 20% of running out of money inside 25years given relatively aggressive return and conservative volatility expectations of a balanced portfolio. The sort of figures that I’m sure not too many believe or are aware of.

Inflation risk is a multidimensional one for retirees. Firstly higher inflation means higher drawdown….which is not good. Secondly, an inflation spike typically means higher bond yields and therefore lower bond prices…which is not good. Thirdly, an inflation spike in the past has also resulted in lower equity prices…which is not good. So an inflation spike can result in a portfolio destroying triple whammy on the retirement income portfolio…whilst this is not a good result in accumulation stage at least there isn’t the impact of the drawdown hit.

Asset Allocation Thoughts

The two risks above strongly suggest a need for a lower level of equities in the portfolio. Sequencing risks can be reduced with lower risk assets and they aren’t exactly a hedge for an inflation spike. So what to do? In the Global Returns Yearbook 2012, Dimson, Staunton, and Marsh examined 17 markets over the last 112 years in terms o inflation hedging asset classes and the best hedges came from inflation linked bonds, and the real assets gold, and property. Unfortunately the real assets are prone to sequencing risks and the only significant issue with inflation linked bonds are their current valuations (i.e. some inflation linked bonds are actually paying a negative real yield…bummer). Whilst there’s no silver bullet for the construction of any portfolio, if reducing sequencing risks and inflation risks is important then inflation linked bonds are a worthy inclusion.

So how much should be in inflation linked bonds? Of course. like any asset allocation decision it depends on the amount of risk one wants to reduce and the return goals of the portfolio. Some time ago, I discovered an approach to retirement income from a financial planner in the US, Mitch Anthony, who uses a Maslow’s Hierarchy of Needs for designing the portfolio…and its quite useful for determining the potential amount in inflation linked bonds. For example, if someone wants to spend $50,000 in today’s dollars each year in retirement, that may for a good lifestyle, but the question Mitch asks is…how much is the absolute minimum  that you must spend? That figure may be $30,000 and is for the base necessities of Maslow’s hierarchy of needs (food, shelter etc)…this annual income must not be placed at risk…and it is this income which potentially could be secured with an inflation linked income. The remaining income could be acquired with the portfolio of cash, bonds, and equities etc. This is obviosuly just one example but is hopefully some food for thought.

One risk with inflationlinked products is that they are linked to a general inflation indicator which is typcally diferent to the inflation level of the retired…studies in both the US and Australia have shown that in recent years inflation for the retired has been higher than for the average population so even inflation linked bonds may not keep up.

tere are other asset allcoation thoughts but in the consideration of article length I’ll leave it at that for the moment.

Product Innovation

There is one product category that has failed to lift off in Australia but has been very popular in the US and that is Variable Annuities. The kind I am specifically referring to are Variable annuities whereby the investor invests in a diversified portfolio of assets (bonds, cash, equities) and an income of 5%pa, give or take, is drawn each year and a fee is paid such that should the portfoio decline, the income is protected for life. OnePath (previously ING) have a product called Money for Life that recently closed and AXA North is another. The problem with the Australian versions of these products are that they are ridiculously expensive. For the AXA North product, last time I checked, the costs of protection were around 3 to 4  times the cost of equivalent products in the US…clearly not a good deal so its no wonder these products haven’t been popular.

From a portfolio perspective, given the goals are largely about the provision of income, these variable annuities have a lot going for them…the ability to take on risk whilst insuring an ongoing income sounds like a good concept to me. If we could see some better priced products I do believe these products have great deal of potential.

Another products that has been spoken of is the deferred annuity. Asteron life had one of these products some time ago, and basically it was an investment today that would pay income, a substantial income as I’ve been led to believe, should you survive beyond your ‘life expectancy’. The problem was, that if you didn’t survive, your invested dollar was not returned to the estate and Asteron kept it for themselves. A second problem was that adviser didn’t believe in the product so didn’t sell it…the product died. There is however, potential for deferred annuities that aren’t as strict with greater liquidity but the life companies are awaiting for government incentives before issuing.

There are many more issues to discuss but my post has gone on too long already. Its obvious the focus of the financial services industry has been on the accumulation stage but the more challenging area is in retiremnet income. The debate needs to start asap on retirement income and more education, better default solutions, and more innovation needs to occur asap. Any person who retired before 2008 with a significant account based pension has seen their lifestyle slashed and our industry must be prepared for the next crash as our age pension is slowly getting worse and the success of our superannuation system is essential.


Apr 08

Bad economic data is underway

Source: www.zerohedge.com

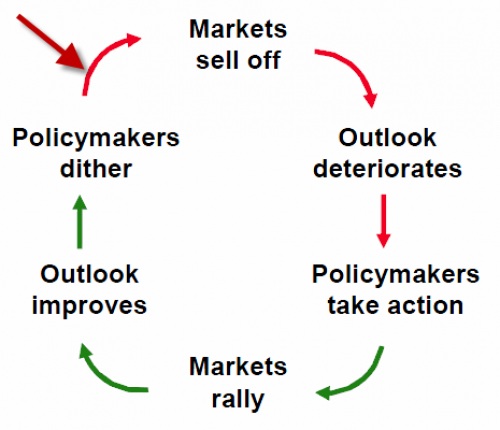
Earlier in the week Zero Hedge showed the above chart and unfortunately there maybe something to it as it appears the outlook may be deteriorating. Whilst policymakers haven’t started to dither in obvious ways at the moment, with the Spanish government announcing increased austerity measures which will only make their economy worse, there are market signs that the European situation is starting to worsen….namely Spanish and Italian bond yields have started an upward march towards uncomfortable bond affordability. (see below charts)

Source: Bloomberg

The last day of the trading week also saw the US post some pretty dismal employment figures…only 120,000 new jobs were gained in March after a strong couple of months to start the year. There were expectations of 200,000 jobs but given 125,000 new jobs are required just to keep up with population growth 120,000 is not a good number. Whilst some of the company data in the US is reasonably good, its obvious they’re still not confident enough to hire and the unemployment problem continues to leave US in the doldrums for many

Anyway, none of this adds up to strong macro signals for the risk-on trade so we can probably expect some increased market volatility this week and beyond. The S&P/ASX200 VIX shown in the chart below is at  relatively low levels and if this was an easily investible index (and its not), this is my current pick as an asset about to rise.

Source: www.asx.com.au

Apr 02

Australian Government Bond Yields…a rate cut suggestion?

Source: RBA

In less than two weeks the yield curve managed to drop around 15bps back to levels similar to those of late January. This is despite slightly stronger equity markets, the ASX200 made it through the 4,300 barrier for the first time in many months, and not that much in the way of really bad news…I would have thought that no really bad news is actually good news.

Anyway, the good news really is that nothing terribly horrible has come out of either Europe or USA, however the not so good news is that our economy is probably softer than many realise. As a nation we are largely a one trick pony, thanks to the Chinese commodities story and our financial services sector is struggling along with many other sectors, that include (but not limited to) manufacturing, tourism, and retail. So if commodity prices come off or Chinese growth looks to slow more than expected than our economy is not going to look as rosy as it would otherwise.

Back to the chart….this reduction in bond yields is confirmation of the weaker Australian economy and in my humble opinion it appears to be somewhat of a late cry for help to the RBA for it to reduce interest rates tomorrow. I’m not convinced this will happen, although with the Gillard government so stupidly focused on a fiscal surplus as soon as possible (despite the aforementioned struggling sectors) then the RBA may have to provide some untargeted assistance by way of a 25bps rate cut sooner than later. I emphasise “untargeted” because monetary policy is a blunter tool than fiscal policy which has the ability to be a little more targeted to the strugglers…well  at least an interest rate decrease might reduce the dollar. Anyway, I digress…given European market’s good behaviour (which is different to its economic behaviour) I do believe rates will stay but the bad Gillard/Swan behaviour may change things.

Mar 28

Bonds…the best protection from risky markets

Source: van Eyk

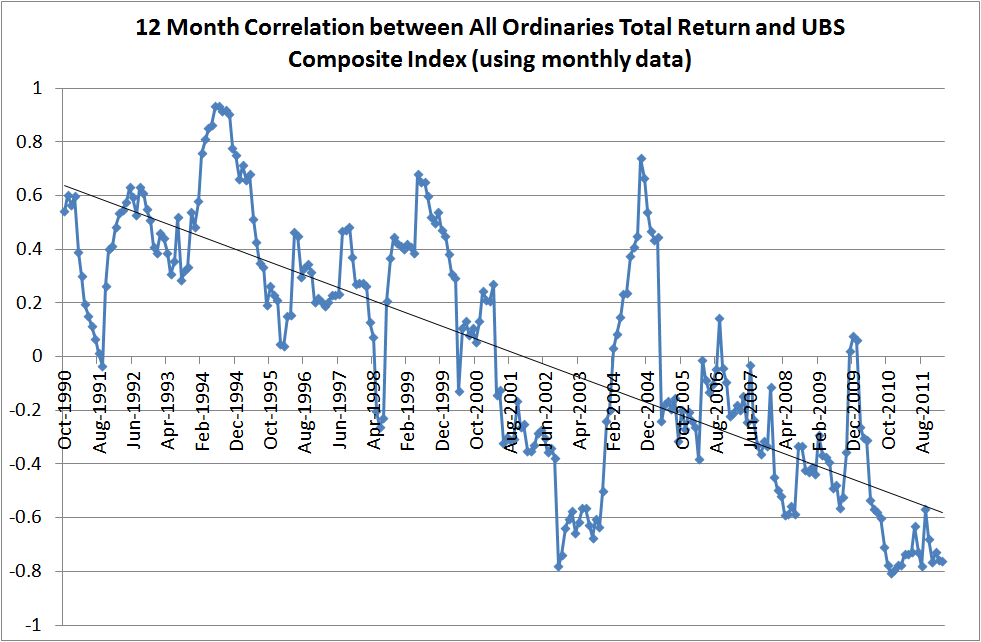
The above chart shows the 12 month correlation of monthly returns between the UBS Composite index (representing Australian Fixed Interest) and the total return of the S&P/ASX All Ordinaries index (Australian shares). As you can see the correlation between both asset classes is extremely variable and the trendline shows that over the last 21 years or so, the correlation has declined from being fairly positive to quite negative.

To me, the most obvious observation of this chart is that the lowest correlations occurred during times of sharemarket/economic stress…so that includes the 1991 recession we had to have, the disastrous markets of 1994, the Asian crisis of 1998, the tech wreck from 2000 to 2003, and most recently the 2008/09 GFC, and the current 2011 Euro-Sovereign crisis.

Modern Portfolio Theory is largely about diversification and the goal of any investor is to construct a portfolio of positively returning negatively correlated assets. We all know that shares go up and down with greater volatility than most other asset classes so a great addition to this asset class is an investment that is positively correlated in the good times and negatively correlated in the bad times…the above chart shows that over the last 21 years, Australian bonds have more or less done that.

So whilst there are many decent arguments suggesting bonds are poor value compared to shares, they still have the potential of providing a cushion to the potential downside that the sharemarket brings to a portfolio and I believe a diversified bonds portfolio is still an important consideration for the diversified portfolio.

Mar 27

Does our Super have too much in equities?

Over the last couple of weeks I’ve been asked to comment on the asset allocations of default super funds. There’s certainly been a very interesting debate through the print media which was probably started by David Murray, Chairman of the Future Fund, last year when he stated that Austrlaian Super Funds were too heavily invested in Australian Equities. More recently, Kenry Henry, previous secretary of the Federal Treasury, who suggested that the bias towards equities by super funds is leading to too much financial instability. There have been numerous responses stating that over the long run equities outperform so they should play a large part of a superannuation portfolio and also statements regarding the relative good valuation of equities versus the low yield currently available on low risk bonds. All arguments have some truth to them.

Personally, I tend to think default superannuation funds have too large an exposure to risky assets. Most default funds run a “balanced” strategy that has around 70% in risky assets, and whilst this could be argued as an optimal strategy over the long run, unfortunately, as retirement approaches this strategy carries the sort of risk that could destroy one’s retirement. As a result, for a cohort (or default fund) I have to admit to being in the lifecycle camp, whereby the risks of a portfolio change over time. So the risk of a portfolio is very high (i.e. high percentage of growth assets) in the early years when one can afford a large loss and in the latter years as retirement approaches the portfolio risks are lower as substantial losses, like a 2008 scenario, cannot be recovered once in drawdown phase.

For anyone interested, I wrote a blog post last year explaining asset-weighted returns whcih is the essence of a lifecycle fund….just click here to read…as opposed to a balanced fund which is all about time-weighted returns. So the key points I’ve made are that a younger person can recover losses whilst a person approaching retirement cannot.

Consider this…

…if a 25 year old has $20,000 in their superannuation fund and they are 100% invested in equities and another 2008 comes along and they lose 40% of their capital, they have lost $8,000. If they earn $40,000 salary and their superannuation contributions are $3,600, then their losses will be recovered from contributions alone in a little over 2 years when they’ll be 27 with many more years left before retirement. If things turn out well then the early returns for the 25 year old are accelerated thanks to the higher exposure to shares.

…if a 63 year old earning $100,000pa paying an inflated $15,000pa into superannuation has a balance of $400,000 and their balanced (70/30) fund experiences another 2008 and loses 20% or $80,000, they require more than 5 years of contributions to recover the losses from contributions alone which brings them to 68 years and well beyond the usual retirement age of 65. So this person has a less risky fund, higher contributions than the 25 year old and yet the chances of loss recovery is much lower and would obviously be more stressful..

These are simple examples as to why the lifecycle approach, in general, is more appropriate than the current balanced approach…and…I believe the lifecycle approach is best for a cohort, as opposed to an individual.

For an individual, i believe the best approach is to seek out the services of a good financial planner who can tailor an appropriate contribution and investment strategy to provide the best chance of meeting one’s individual retirement income goals. This could cover any contribution level and any investment strategy as it is client goal specific.

Unfortunately for the government’s future age pension liabilities, around 80% of individuals take little notice or action on their superannuation investments so ensuring the appropriate default strategy is important….and the balanced fund is not the answer.

Next steps…and probably next blog post…the retirement income solution!

Older posts «

» Newer posts