

No its not my quant view but the famous Macquarie Research quant research paper on the Melbourne Cup can be found here… MFS Equitiess Research – Melbourne Cup Research!
Oct 22
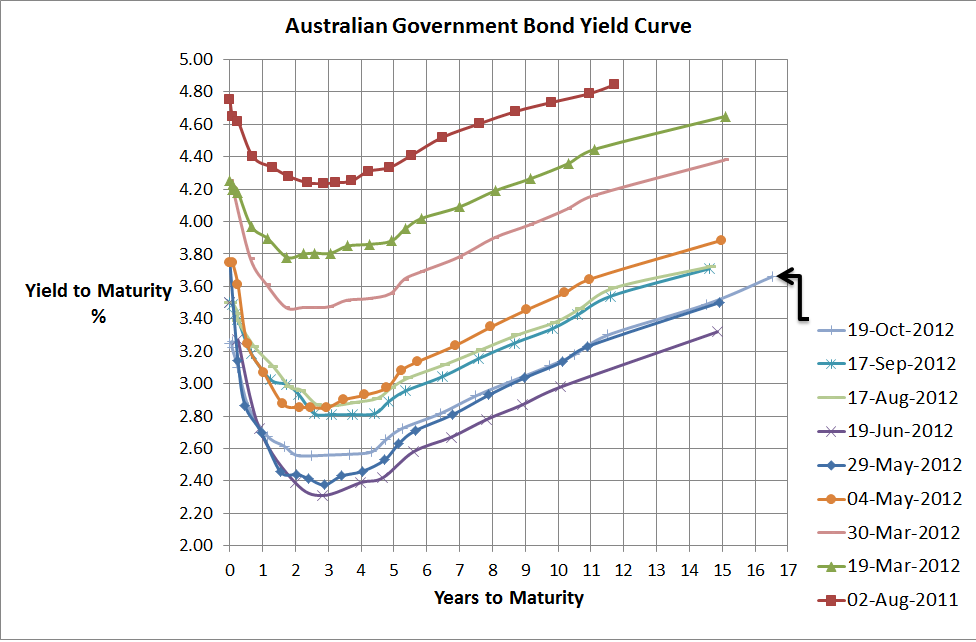
Australian Government Bond Yield Curve…still struggling
Source: RBA & Delta Research & Advisory
I can’t believe how time is flying and it is more than a month since I posted my last bond yield curve. The Mid Year Economic & Fiscal Outlook released today has provided numbers supporting a further slowdown in government revenue and this economic weakness has certainly been reflected in reducing bond yields over the last month as well as since the Budget in May (where its down around 25bps). We all know the Reserve Bank reduced its cash rates by 25bps a few weeks ago and over the last month the yield curve is also down around 20-25bps. Interestingly we have a new data point (or 16.5 year government bond) which has been trading for a little over a week so if you’re gong to raise money at these low rates why not raise the capital across the longest period possible.
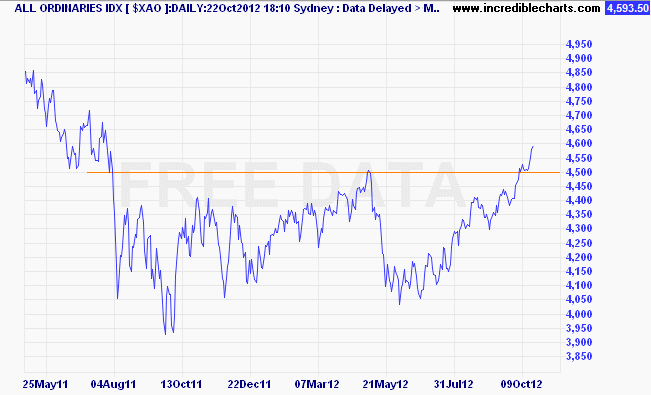
Whilst the bond market is showing signs of economic weakness the sharemarket has finally broken above the 4500 barrier that has proved so difficult over the last year or so (see below chart). The feeling is that there isn’t too much that can shock anymore so sharemarkets have become quite relaxed about the worsening European data, although perhaps the, by and large, better US economic data has provided some of the confidence that global economic recovery may move faster than previously expected…who knows.
What I find most interesting in the behaviour of markets in recent weeks is that both bond markets and sharemarkets have increased in price and that is completely different to the last 5 years where they moved in opposite directions. I don’t really know why that’s the case and its not necessarily wrong…perhaps both markets were underpriced or they are being driven by different fundamentals…at the end of the day week to week or month to month movement contains a lot of noise and whilst bonds yields are near record lows, which is not a good sign for our economy, its pretty safe to say that sharemarkets are still largely languishing compare to 5 years ago when the All Ords was over 6800.
Source: Incredible Charts
Moving along, the outlook is still cloudy…the US is recovering but very slowly and unemployment is still uncomfortably high; the European situation is years away from resolution and the survival of the Euro is still not guaranteed (but markets have certainly calmed over the past few months); but the bigger news is the slowing Australian economy thanks to the resources boom not booming as much as we’d like and the rest of the economy continuing to splutter along. Despite that the government is still expecting unemployment to be fairly low and economic growth has only been revised down 25bps in 2013.
For me, the best bang for your buck continues to be term deposits that continue to pay 200bps to 250bps above government bonds but aside from that its difficult to go beyond a diversified portfolio across all major asset classes.
Oct 10
Impact of the rate cut on house prices
I am a little amazed at how many articles across the newspapers of Australia have suggested that residential house prices are going to go through the roof given the latest interest rate reduction from the RBA. The chart below shows that house prices have declined over the last couple of years or so, but somehow its the latest cut that will send prices upwards.

Source: RBA
I thought I’d do some smple mathematics to determine how much a 0.25% interest rate reduction improves the borrowing capacity. So to keep it simple, if someone had the capacity to borrow $400,000 last month (before the interest rate decrease), then assuming their ability to make principle and interest payments is unchanged, the interest rate reduction of 0.25% (and we know not all banks have passed this on), only increases their borrowing ability to a little over $410,000 for a thirty year loan…or around 2.5%…so the impact on the above chart should be no mroe than what statisticians call noise.
The bottom line for the rate cut is in Glenn Stevens conclusion when he said,
the growth outlook for next year looked a little weaker
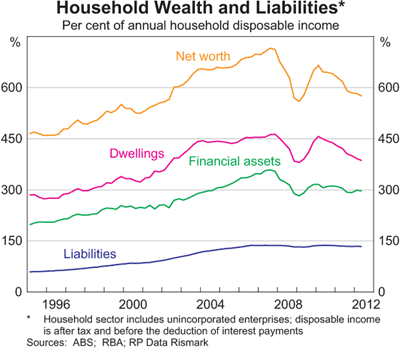
Hopefully the interest rate reduction improves the outlook for growth, but its very difficult to see too much increase in housing prices until there is improvement in the household balance sheet. The following chart shows that household asset values have declined whilst our debt levels have stayed roughly the same…with savings rates continuing near double digit levels (see final chart), as a nation we are largely in deleveraging mode and I’m confident that will continue for a little longer whilst debt levels continue to be near the highest levels in the world.
Maybe I’ll be wrong but if I am wrong about house prices, I can only imagine our household debt levels will be at truly frightening levels.

Source: RBA
Oct 05
Outlook for Bond Returns…
Source: Delta Research & Advisory, RBA, Morningstar Direct
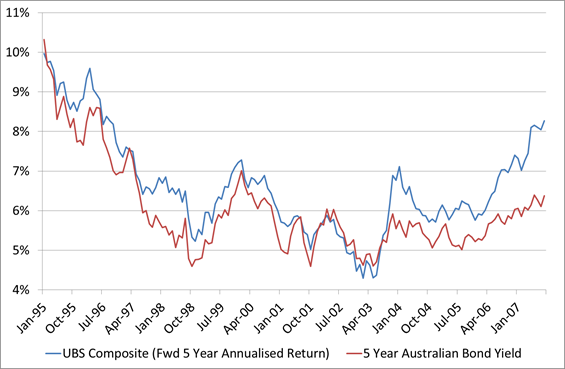
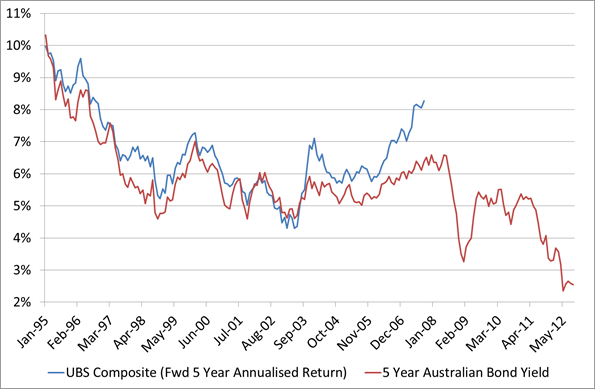
The above chart shows the forward 5 year annualised return of the UBS Composite Index and the 5 year Australian Government Bond index. The last data point in the chart is Septembr 2007 meaning the forward 5 year return is the annualised return of the UBS Composite from September 2007 to September 2012 (or last week). What it shows is quite a strong correlation between the two variables. In fact, if you run a regression between the 2 variables then the 5 year Australian Government Bond yield explaiins 82% of the variability on the 5 year return of the UBS Composite in a 1 to 1 relationship plus you can add around 0.62%pa which would explain the additional credit risk that exists in the index.
The forward return of the index obviously deviates from the bond yield over the last 4 years and this is obviously GFC related and migt be explained by the widening credit spreads. Either way, the formula of 0.62% plus the 5 Year Aust Government Bond yield appears to be quite a strong potential predictor.
So what does the forward return expectation look like…the following chart tells the story…
Source: Delta Research & Advisory, RBA, Morningstar Direct
Using the formula calulcated, the last data point in this chart shows the 5 year Australian Government Bond Yield at approximately 2.5% plus 0.62% = 3.12%pa over the next 5 years. If you want to be a little more bullish in return expectations perhaps add another 0.5% or so thanks to the still reasonably wide credit spreads and you get a return of 3.6 – 3.8%pa over the next 5 years…lets say 4%pa…why not!
No matter which expected return you take they don’t look too attractive, and when you consider that you can currently get a 5 Year government guaranteed term deposit from a bank, credit union, or building society for well over 5%pa,(although you have to shop around) the fixed interest decision starts getting a little easier.
Sep 18
Australian Government Bond Yield Curve…no change???
Source: RBA, Delta Research & Advisory
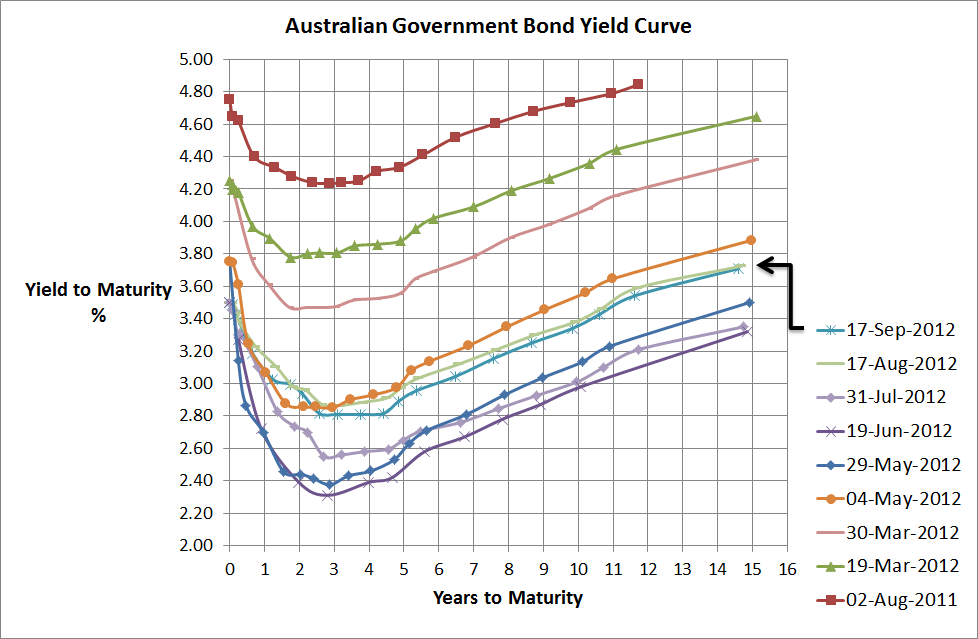
Bizaarely as it seems but the above chart shows that over the last month the Australian Government Bond Yield curve has barely budged. There’s really no more than 5 to 10 bps difference across all terms and when you consider the various big announcements, economic results from here, overseas and the sharemarket increase over the same period (S&P/ASX200 up by around 4.3%) you would have thought some type of change would have flowed through.
Ben Bernanke’s QE3 announcement has helped risky assets around the world as expectations that investment banks and banks will be allowed to freely speculate (lets face it Ben’s really helping the banks more than the unemployed) and Draghi’s bond buying plan certainly saves the Euro in the short term. Other big issues have been China’s slowdown and the reduction in commodity prices (although a small rebound recently). So there probably hasn’t been a great deal of high quality bond selling for the purposes of investing in shares or risky assets and its probably more the central banks are allowing bad collateral to be used to convert to cash so there hasn’t been much need to sell the good collateral.
Overall, I don’t have a great to say that’s different from the past. There are still some macro risks, bond prices have poor long term value but are sill likely to be the best hedge to equity market volatility. I do believe equity market volaitlity is likely to increase and that is the best investment call I can think of (not so easy to implement…nor is at advice for anyone to implement). Term Deposits are still paying 200-250bps higher than government debt for similar risks so look good value. Credit risks look pretty good compared to the past but are correlated with equities so are potentially a moor portfolio diversifier. Residential property will continue to be under pressure whilst Australians continue to deleverage their frightening balance sheets which are amongst the most leveraged in the world. A-REITs and Global REITs are still a concentrated wild ride and anyone’s guess…I prefer to diversify a little more. Aussie dollar…still looks too high…I could be saying that for a while though. Hedge funds and other alternative strategies may provide potential but I must caution any retail investor against investing in vehicles they don’t understand and lack transparency…let’s face it the past doesn’t equal the future so last year’s great performer is rarely this years. Hybrids are trendy again as the chase for yield continues but there are some pretty bad conditions associated with them…60 year terms…give me a break!
A fairly random rambling from me today so I thank you if you’ve managed to read this far!
Sep 13
Australian Share Managers – Alpha and Risk Factors
My new company, Delta Research & Advisory, has recently conducted some risk factor analysis of Australian fund managers and it is starting to yield some interesting results. We’ve analysed around 120 managers using Fama/French-like risk factors where thhe value/growth factor is simply MSCI Australian Value index minus MSCI Australia Growth index and the Size factor is MSCI Australia Small Companies minus MSCI Australia Large companies.
Using the outputs of the analysis we were able to re-classify (I say re-classify because the results showed different classifications to Morningstar across both factors) each fund to Value, Neutral, and Growth styles plus Small, Neutral, Large cap biases…these biases were calculated relative to the broader index funds from BlackRock, Vanguard, State Street, and Macquarie.
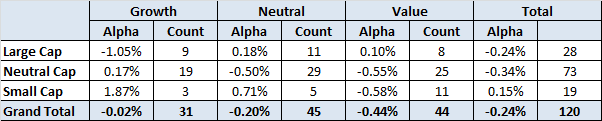
One of the outputs from the analysis is also the level of risk-adjusted alpha (or skill) each manager possesses and whilst I’ve performed the analysis over 5, 7, and 10 years the resultsthe table below shows results from the larger 5 year analysis. Anyway, the style versus skill output came out as follows…
Source: Delta Research & Advisory
I haven’t performed any signifcance testing so my conclusions may be a little enthusiastic, but either way, the numbers show that potentially Growth (& to a lesser degree Neutral) Managers only have skill (alpha) in Small cap land (albeit a very small sample size) and Value Managers only have skill in Large Cap land. Perhaps this may be the start of evidence that produces another way of assessing managers…not sure yet…but the results are potentially quite fascinating (at least for a quant geek like me).
Now the more perceptive of you might say that these alpha/skill results are simply the output of their style biases…that is, Growth managers being successful in small cap land is due to the fact that they are growth managers…my response is that the alpha results produced have already taken style bias into consideration. The alpha we have calculated is representative of the skill that is left after the growth/value and small cap style effects are removed. Therefore alpha is independent of style.
I kow that last paragraph is probably so full of quant geek talk that I’ve lost you but trust me when I say the results have all biases removed and my previosuly stated (potential) conclusion remains…
If you ‘re going to invest in Small Caps it “may” be better to choose a Growth Manager and if you’re going to invest in Large Caps it may be better to choose a Value Manager or perhaps not a Growth manager…pending further statistical analysis 🙂
Sep 04
Modern Portfolio Theory – Passive versus Active…again!
Not a great deal of posting the last couple of months due to a combination of conferences, flu, and just plain busy so hopefully I can increase the frequency moving forward.
A couple of weeks ago I was at a conference and Modern Portfolio Theory was receiving an absolute caning from those on stage. They basically suggested that it obviously failed during the GFC, markets are clearly inefficient and its time to start trying to time markets and move towards dynamic asset allocation…apparently timing markets and successfully implementing dynamic asset allocation to add value to client’s portfolios is easy. Anyway, whilst I believe there is potential value in moving towards dynamic asset allocation (let’s face it clients want it) unfortunately Modern Portfolio Theory is not to blame and its the poor implementation of Modern Portfolio Theory from an asset class perspective that has failed, not so much the theory (although its far from perfect and is flawed). Modern Portfolio Theory says the optimal portfolio is the”Market Portfolio” and across asset classes we have never actually seen this portfolio or been close to this portfolio and probably never will. The 70/30 default superannuation portfolio in the Australian industry is so loaded with equities that to suggest that it is diversified sufficiently and that Modern Portfolio Theory is to blame for its recent failure is ludicrous.
Anyway, I digress…where Modern Portfolio Theory has been implemented well is within the Asset Class…that is, market-cap weighted index funds are very good replication of what Modern Portfolio Theory is supposed to produce in terms of the optimal portfolio within an asset class. However, if the market is so inefficient as the conference speakers explicitly said, then professional active managers should be able to outperform the index consistently…because, lets face it, these anomalies and mispricings are apparently so prevalent that “how can you not notice”…yes I am being a little facetious.
So, around a week and a half ago the latest SPIVA report (yes, my favourite report due its consideration of survivorship bias) was produced on the Australian retail funds management industry and still the index is the convincing winner…except, once again, in small cap Australian shares where the big boys don’t play.
To save you reading the headlines, the key takeouts for each major asset class are…
- At least 70% of active retail funds UNDERperformed the benchmark over the last year and last 3 years
- Approximately 69% of active retail Australian equity general funds failed to beat the S&P/ASX200 Accumulation index
- Almost 90% of active international equity general funds underperformed the benchmark over the last year. Over 3 years and 5 years, at least 72% underperformed.
- ALL ACTIVE RETAIL AUSTRALIAN BOND FUNDS studied in the SPIVA report failed to beat the S&P/ASX Australian Fixed interest index over the last year!!!! 92% failed over the last 5 years.
- 30% of active Australian bond funds failed to survive over the last 5 years…and this has been a good performing asset class.
- 86% of active A-REIT funds failed to beat the S&P/ASX 200 A-REIT index over the last year and 65% failed over the last 5 years.

Source: Standard and Poors
As the above chart shows, buying active managers in retail space ahead of the low cost index funds is a very difficult sell unless you’re looking to buy in small cap space (and you’d be hard pressed to provide a strong reason for going with index funds there).
I’m afraid Modern Portfolio Theory is far from dead and the active guys are continuing to struggle and if you think that this may be Australian specific then one look at the SPIVA reports from other regions will show you that that’s not the case. Whilst these results are compelling in favour of index funds…never forget that index funds cannot exist without the existence of active managers.
Aug 20
Australian Government Bond Yield Curve…continued improvement
Source: RBA
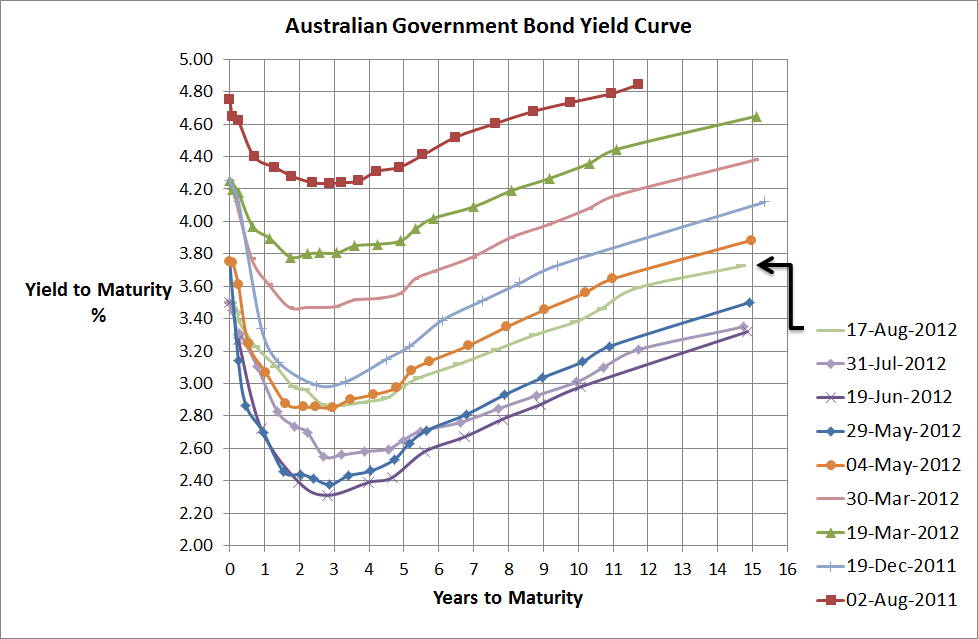
With equity markets improving over the past few weeks, so too have Australian Government Bond yields increased. 10 Year yields were below 3% a couple of months ago and now they are hovering near 3.5%. For Australian bond fund owners that should be a capital loss of close to 2% since mid-June. Nevetheless there’s a long way to go for a normal yield curve.
To be honest its feeling like the calm before the storm at the moment. Volatility indices are their lowest for a long time (Chicago VIX is around 13) and all appears fairly quiet on the European front. However, in September the Troika (ECB, EC, IMF) conducts its quarterly review on Greece’s progress and the early rimours are that the Greeks still aren’t making any headway on theiir austerity program. It’ll probably end up in more “kicking the can down the road” but a worst-case scenario would be the beginning of the end with the folding of the Greek coalition.
Anyway, I don’t really kow whats going to happen but the key message here is that’s way too early to get too over-confident with thiis strong little run in equity markets and recent sell-off in bonds. September will be a more interesting month.
Aug 11
Investment Perspectives
Its been a while since I put some of my broader investment thoughts in writing and I’ve just written almost 4000 words to satisfy that…so it also sort of makes up for my lack of posting. So below is a lot of what I have written and hopefully its readable for anyone interested…I actually haven’t read it, I’ve just written it. Anyway, my thoughts are divided into asset classes and I know there’s a lot to read if interested otherwise you can open a PDF here…oh yeah, Delta Research & Advisory is my new consulting company if you think I’m steeling the PDF document from another company!
Whilst writing this my mind tended to wander so there may be some inconsistencies from section to section and I know some of the arguments may be read as insufficient or flawed but, oh well, that’s the way it goes i didn’t really feel like writing 10,000 words.
Background
The economic environment continues to be relative fragile despite European woes calming somewhat. The China slowdown continues as weaker economic data continues to flow and in the US, mixed economic results continue and should continue through to the election at which point the next term’s president will need to deal with the “Fiscal Cliff” which will be a 3-4% hit to US GDP should it go ahead.
Overall the global economy, like during the great depression, is currently undergoing a massive deleveraging. The debt of the private sector is shifting to the public sector and it has revealed the flaws in the European Monetary Union. The deleveraging process has many years to play out and so too does the resolution of the European situation where it is widely accepted that Greek will exit with the strong potential of others to follow.
This economic backdrop may continue to present shocks to equity markets and keep uncertainty high resulting in high equity market volatility and low bond yields for highly rated sovereigns (US, Germany, UK, Australia, Switzerland) for many years to come.
Cash
The Reserve Bank held fire on cash rates at the start of August and with decent unemployment figures (5.2%) announced this week, whilst Europe doesn’t get too much worse, cash rates are likely to stay the same. At 3.5%, the Reserve Bank’s yield is much higher than longer term bond yields.
Short duration term deposits (< 1 year) continue to be very attractive as Australian banks continue to fund their future needs from local investors given European debt concerns effectively shuts down that market. It is possible to get 5.3% for a 1 year term deposit and this represents a premium of more than 220bps over 1 year government debt. When you consider the equity risk premium over the last 50 years in the Australian market has only been around 300bps over government bonds that is an attractive offer for a government guaranteed investment.
Fixed Interest
Australian
The last month has seen Australian Government bond yields increase by around 40bps or more and 4 year bonds are now yielding around 2.8%. This yield is significantly below the RBA cash rate and the negative shape of the yield curve out to 3-4 years reflects the market’s view of economic troubles ahead for Australia. With a yield this low, conservative boring government bonds are certainly unattractive for long term investors but they have proven to have the lowest correlation with sharemarket volatility in these economic times so its difficult to ignore them in a diversified portfolio.
Once again, the real value for longer maturities (> 1 year) comes in the way of term deposits. Today it is possible to receive 5.5% for 2 years or 5 years; whilst 5.25% is possible for 4 years and this represents a premium of 245 basis points over Australian Government bonds and is therefore very attractive and much better value than pure government bonds given the government guarantee is still in place for amounts less than $250K.
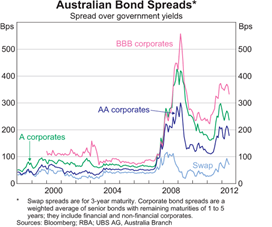
Accepting more credit risk currently appears to have potential. In recent weeks, Westpac announced an Unsecured Subordinated Notes issues whereby it promises to pay 2.75% over the 90 day BBSW rate each quarter. With 90 day BBSW currently around 3.6%, this represents a floating interest rate of 6.35%pa. which is significantly higher than term deposit rates and paid by a “Big 4”, “too big to fail” bank. Despite these being lowly ranked in the capital structure, it is difficult not to be tempted. Other listed hybrids in the market are also paying significant premiums over government bonds. With bond spreads still historically relatively high (refer Chart 1), accepting credit risk does appear to be reasonable value in the so-called stronger economy of Australia. If accepting this strategy, diversification is key, but also keep in mind that credit spreads provide less protection when equity markets fall so be prepared for volatility of return and to hang in there for the long term.
Chart 1
Source: RBA
Global
With bond yields at historic lows for all major sovereigns (who have their own currency…and this assumes Germany owns the Euro) such as US, Japan, Switzerland, and UK; its difficult to see any long term value. But once again, the boring low risk Global bond fund shows that it is the true diversifier to significant equity market volatility. Over the last 12 months Global Bond indices have return between 10% and12%, despite yields already being so low that many commentators suggested there was no value one year ago either.
So like Australian Government Bonds, a diversified boring Global Bond fund should play a part of a diversified portfolio to cushion equity market volatility (assuming this is of concern).
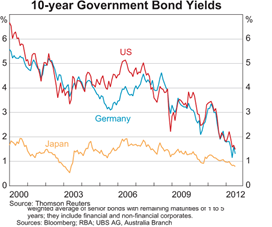
A second advantage of Global Fixed Interest continue to be the carry when hedge back to Australian dollars. Because RBA cash rates are 3.5% and Global sovereign cash rates are near 0; this means there is an additional ~3.5% added to the global bond yield. Whilst, 5 year bond yields across major economies are no more than 1%, then this currently produces a 4.5% yield when hedge back to Australian dollars and this is a little higher than Australian government bond yields. Of course, if the RBA continues to reduce its rates then this carry will reduce along with it and when rates do ultimately turn (and this may take years), then the downside potential is quite large.
Chart 2
Source: RBA
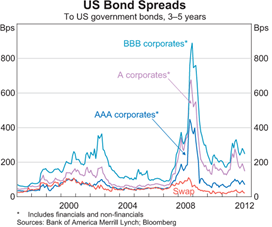
Once again, despite being a poor diversifier with equity markets, the reasonable value in Global Fixed Interest appears to be in credit markets. Obviously with weaker economies in the US and Europe, you should receive a higher premium but as chart 3 shows, premiums in the US are still near levels seen near the height of the tech wreck.
Chart 3
Source: RBA
In the US, equity risk premiums over the last 100 years have only averaged around 300bps so with similar premiums offered by BBB corporates, that appears to be reasonable value compared to equities for a well-diversified portfolio of credit securities.
Property
Australian
A-REITs continue to trade below Net Asset Values however the exceptions are the management companies such Westfield Group. Despite this apparent value potential it is interesting to note that for the top 10, Real Estate companies on the ASX, the independent broker research house Morningstar, has a rating of HOLD or REDUCE on each one. Certainly Morningstar doesn’t see value in this sector.
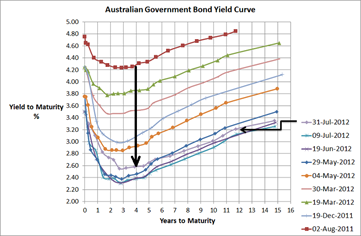
Australian residential property prices have been declining over the last 12 to 18 months and with a negative bond yield curve (Chart 4) suggesting an economy getting weaker, perhaps there’s expectation that book prices of the listed properties will be declining.
Either way, despite recent good performance, listed property has proven to be a poor diversifier and poor performer over the last 10 years relative to Australian equities and whilst this sector should continue to pay higher dividends than the broader sharemarket it is difficult to understand whether the additional concentration risk this sector has is worth it.
Given Westfield and Stockland make up 50% of the Australian listed property market the success of a fund manager will depend on their decisions on these two stocks…indexing makes most sense…and it is difficult to suggest an overweight position for this over rated sector.
Chart 4
Source: RBA and www.fureyous.com.au
Global
Investing in Global Property Securities funds in Australia has not been around many years but for those who have invested in anything but Index funds, it has been a frustrating experience. There are around 20 funds that have 5 year track record to the end of July 2012 and only 2 have managed to outperform the Hedged Vanguard International Property Securities fund (BT & UBS). Over the last 3 years only the geared CFS Global Property Securities fund has managed to outperform the Vanguard fund (but is at the bottom of the pile over 5 yers). Paying for active management in a sector that many researchers believe is inefficient has hardly worked at all.
Anyway, there’s little doubt global property securities have had an excellent run of returns over the last 3 years whereby the index returned around 25%pa. Over 2007 and 2008, this asset class dropped more than 60% so the 25% per annum doesn’t appear so bad. However, once again what it does show is that as an asset class there are significant question marks around its validity. These highly volatile returns don’t resemble the inflation hedging consistent income investors wish to receive from property securities funds. Instead they have received scarier than equity like returns and once again its difficult to mount an argument to overweight this asset class relative to the more diversified global equities.
Equities
Australian
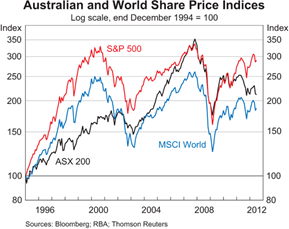
Chart 5 shows that when it comes to diversification the Australian sharemarket has provided little to no shelter from the major global sharemarkets. Increases in the Australian market are likely to coincide with increases in global sharemarkets and vice versa. Chart 5 also shows how the Australian sharemarket has more recently underperformed the S&P500, despite Australia having a much stronger economy than the US…this is simple evidence supporting the relatively weak correlation between economic performance and sharemarket performance.
Chart 5
Source: RBA
So does this price diversion mean that there is potential for the Australian sharemarket? I guess before answering that, we need to understand what the main drivers of the Australian sharemarket are. Unfortunately, the Australian sharemarket is quite concentrated and comprises roughly one-third resource stocks (actually 28%), one-third financial services (actually 42%); and one-third that is somewhat a mixed bag (30%). Compared to global sharemarkets, the Australian market has very little technology (<1% vs 10%), healthcare (3.75% vs 10%), or consumer discretionary (<3% vs 11%).
As a result with the large resources sector it has been very exposed to the slowdown in China and the 2012 sell off in Commodities plus the European woes have had a negative impact on our financial services sector…refer Chart 6.
Chart 6

Source: Morningstar Direct
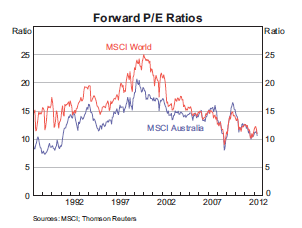
In terms of valuations, our sharemarket appears historically cheap on a PE basis…refer Chart 7…and this has been a consistent story from many fund managers. The major risk with this simplistic valuation analysis is that earnings forecasts have also been in decline (refer Chart 8) so if the price declines at the same rate as the earnings decline then there is no change in PE…but the outcome for investors is obviously poor.
Chart 7
Source: RBA
With the slowdown in China and the rest of the world the big question will be, will Australian company earnings expectations continue to decline. If so, then so too will prices and it won’t be a good results for sharemarket investors.
Whilst it is very difficult to predict the direction of sharemarkets, it does appear that they will continue to be volatile and experience external shocks from the macroeconomic issues in Europe, China and the USA. The success or failure of these economic scenarios will be the true drivers of Australian sharemarket returns and it is impossible to know what the outcomes will be.
Chart 8

Source: RBA
Longer term, the PE has been a reasonable indicator of long run return potential ad Chart 7 does indicate that both the Australian and global sharemarkets have significant upside potential…its just when that potential will be realised is the big challenge.
Whilst the Australian sharemarket is relatively concentrated, it does offer Australian investors around a 1% additional gross return from franking credits that are not available to overseas investors.
Global
The issues affecting global sharemarkets are pretty much the same as Australian sharemarkets. The European situation will be a large driver as will the slowdown in China and the ultimate outcome of the US Fiscal Cliff.
As mentioned before, the main advantage of global sharemarkets is the fact they are diversified across many sectors that are not widely available in Australia. Fundamentally, investing overseas isn’t really much more than a diversification play. That is, diversification across currencies, economies, industries, sectors, and a variety of other risks. Don’t forget, diversification is the only free lunch in finance and whilst over the last 100 years the Australian sharemarket has pretty much outperformed all others, we certainly don’t know if that will continue.
To demonstrate the different sector exposures, Tables 1 to 3 show the differences in Sectors between MSCI Australia, MSCI EAFE, and S&P 500…please note that combining S&P500 and MSCI EAFE is similar to MSCI World Index.
Table 1
| Sector |
MSCI Australia |
MSCI EAFE |
S&P500 |
| Financials |
41.9% |
22.4% |
14.4% |
| Materials |
22.0% |
9.5% |
3.4% |
| Consumer Staples |
8.4% |
11.7% |
11.3% |
| Industrials |
6.8% |
12.4% |
10.4% |
| Energy |
6.2% |
8.3% |
10.8% |
| Telecommunications |
4.9% |
5.6% |
3.2% |
| HealthCare |
4.0% |
10.0% |
12.0% |
| Consumer Discretionary |
3.1% |
10.5% |
10.9% |
| Utilities |
2.0% |
4.3% |
3.7% |
| Information Technology |
0.6% |
4.4% |
19.7% |
Source: iShares.com.au
Currency
Valuing a currency is one of the most difficult tasks in finance. Ultimately the strength of the Australian dollar will be determined by how much money flows into Australia. Since the depths of the Global Financial Crisis, the Australian economy has been resilient and with a strong banking system, sovereign credit rating of AAA, relatively high interest rates, and low levels of government debt suggesting good fiscal management, significant capital has flowed into Australia.
Chart 9
Source: Tyndall Investment Management & Bloomberg
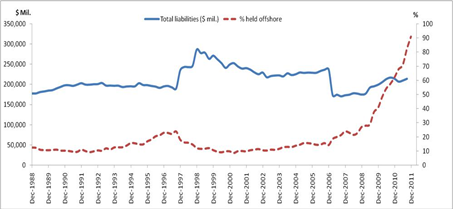
As Chart 9 shows, at the end of last year around 90% of Australian Government debt was owned by offshore investors. How much higher can this go? Well it can’t get to 100% assuming locals own something, but if it flows out then it would definitely have some downward pressure on the Aussie.
Chart 10 shows the performance of the Australian dollar and whilst past price doesn’t or shouldn’t be able to predict future price, this prce path does suggest that it can be volatile and can drop rapidly in tough times when the global reserve currency, US Dollar, comes into play.
Chart 10

Source: RBA
This simple analysis suggests that there is possibly more downside risk to the Australian dollar than upside potential. As a result, for global equities my preference is hold more unhedged positions than hedged positions.
This however, is not the case for the lower volatile or income focused asset classes where the volatility of the Australian dollar can overwhelm the risks of the asset class you are trying to capture. As a result, I believe (and probably always will) that Global Property (Infrastructure) and Fixed Interest asset classes should always be fully hedged to Australian dollars.
Alternatives
With equity markets expected to be volatile, fixed interest markets at record low yields and cash rates expecting to go lower, property behaving equity-like, its difficult to think of a more difficult time to invest…particularly for those who need higher returns. So the natural step for many may be to look outside of these traditional asset classes and consider alternatives.
Fundamentally there are two types of “”Alternative” investments…
- Hedge Fund Strategies
- Real Assets
Hedge fund strategies are a difficult sell for the retail investor as they are not simple to understand, you never really know what risks they are accepting and therefore lack transparency, and most frustratingly, they are typically very expensive…contrary to popular belief the 2 and 20 still exists.
That leaves Real Assets. These may come in the form of direct investment in Infrastructure, Direct Property or Commodities. Infrastructure and Direct Property differs from their listed cousins simply from a liquidity perspective whereby additional returns may be gained by giving up the liquidity that a sharemarket provides.
In general with the world currently deleveraging, illiquid assets are historically cheap as low risk and highly liquid assets (like US Treasuries) are in high demand. Because the current situation is expected to be around for many years, this means buying illiquidity must be a long term strategy so investors must be prepared to invest for the long haul and no one really knows how long this is.
Commodities, which can be traded on a spot market or using derivative contracts such as futures or forwards, represent potential hedges to inflation or in the case of Gold, a hedge against the instability of the global financial system. As opposed to traditional asset classes, Commodities do not pay income and are really subject to simple supply and demand. Gold, once again, is a little different in terms of the supply/demand relationship as it is an element that is relatively useless for anything other than jewellery and its hedge to the global reserve currency, the US dollar.
Over recent years, commodities have performed very well thanks to the Chinese economic boom whereby the Chinese were building cities the size of Brisbane almost every month. With the slowdown underway, commodity prices have come off and whilst there is a limited supply which means owning a scarce resource makes sense, the current risks ensure this asset class continues to be volatile and potentially damaging to financial health.
Whilst the Chinese have not been buying Gold to assist with their growth, gold has been purchased in the face of US weakness over the last decade such that it is the best performing asset of all. Despite that, with the potential of a Euro collapse still around, this presents some potentially strong reasons for owning some of this financial system hedging asset.
Volatility
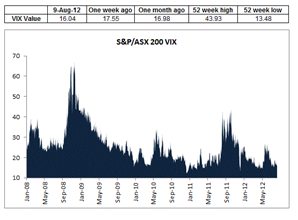
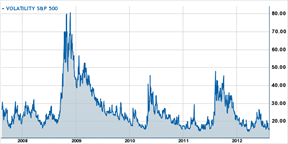
Chart 11 shows the VIX index for both the S&P/ASX200 and S&P500 over the last 5 years. The expected volatility is near their absolute lowest which given the potential downside risks thanks to the 3 largest economies of the world (US, Europe and China); volatility currently appears relatively cheap. What this means in an investment perspective is that buying volatility may be better value than selling volatility so buying options may be a reasonable way of entering a position to support a view. There are hedge fund strategies that buy or sell volatility and now appears to be a buying opportunity.
Chart 11 – VIX Index of ASX200 and S&P500 respectively
Putting it all together
Whilst the above comments include opinions of high volatility, low yields, low return potential and probably some questionable or weak arguments; it is very very difficult to time markets or even pick the direction of markets. As a result, we must rely on the only free lunch in investing which is diversification.
Whilst I do believe investors would be wise to be underweight equities, its not because of its return potential (which is actually quite high should consumer confidence return) but because of its high volatility expectation; therefore holding equities is still important as should be bonds, cash, maybe listed property (although it should be part of a diversified equities portfolio) and even commodities.
How it is all put together depends on one’s propensity accept risk combined with return needs. If a high return is required (e.g. 10%pa) then there is little option but to hold equities or at least some non-investment grade credit. However, if one’s needs are only for capital preservation and a return goal of around 5% then there is little need to accept any more risk than the currently well-priced term deposits offered by many Australian financial institutions. Obviously if in between then a combination of multiple asset classes is appropriate.
Aug 02
Australian Government Bond Yield Curve…slight increase but risks remain

Source:RBA
The above chart shows that over the last few weeks there has been an increase of around 10-25bps across the yield curve which is also in line with the marginally stronger equity markets. As I’ve stated numerous times before, the European situation is what is currently driving most major market moves and the partial bailing out of the Spanish banks has calmed markets for the time being and this has resulted in a slight increase in market confidence.
The other interesting outcome the above chart shows is that over the past 12 months the yield curve has dropped by around 150-170bps. Given the Australian fixed interest market (i.e. UBS Composite Index) has a duration of just short of 4, that indicates that most conservative bond funds should have provided a capital return on top of interest of at least 6% (4*150 = 600bps). The index did actually return 10.97% in the year to the end of July so assuming an average coupon of around 5% that adds up. Unfortunately it appears that more managers chose to have shorter duration than the index over the past 12 months and most managers appear to have underperformed.
Moving forward there is no doubt, the European situation will dominate. There is still limited evidence that the problem of the Euro will be resolved any time soon and that a Greek exit will happen so there is to be more volatility in all markets. The other big issue which will be resolved one way or the other is the US Fiscal cliff, which should be a hit to US GDP of around 3-4%, which comes next January. It’ll be resolved one way or the other following the elections, but this uncertainty is bound to also contribute to market volatility. Finally, the China slowdown is increasingly evident with poorer numbers out of China….this is hardly a good sign for the Australian economy whose success has largely been on the back of the Chine-led resources boom…but we all knew that was coming anyway…the question is how low can China go???
Whilst I know I get a bit of criticism for this view, the best bang for your buck in Australia continues to be term deposits where the premium above government bonds continues to be attractive and they continue to carry the same risk for investments less than $250K. Whilst many believe that a term deposit has failed to receive the short term capital gains that bonds have received, my response is that capital gains are irrelevant for all fixed income securities if held to maturity which is typically the purpose of choosing a specific term. As the professional bond managers have shown, playing the yield curve or duration, is a very tough game.