Feb 06

Sharemarket exuberance reflected in higher earnings forecasts…not

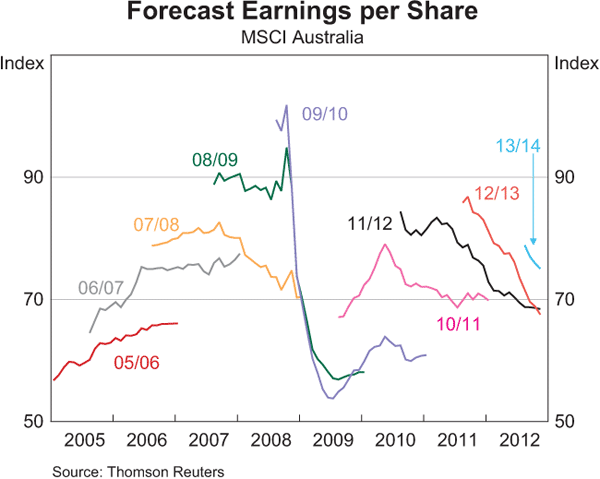
EPS Forecasts

Source: RBA

The RBA released its chart pack today and there are few charts I always like to look and in recent months its been the above, Forecast Earnings per Share. Its very difficult to see but the update to this chart shows a tiny movement sideways…so…its the first time for quite a few months that forecast earnings haven’t declined for 2012/13. Obviously the market rejoiced in this fact and ran up another 5%.

Over the last 6 months, the Australian sharemarket has returned over 17% whilst forecast earnings decreased by almost the same margin….that should be one sizeable PE expansion of roughly 25% to 30%. The expected growth doesn’t quite justify this expansion so, at the risk of repeating myself, be careful when it comes to sharemarkets as they are possibly riskier than they currently appear and when the money printing stops so may the current momentum.

Please note that this is not a sell recommendation by any stretch as this run could continue for some time, but once again its a warning to not get carried away or be fearful of getting in before missing out.


Jan 11

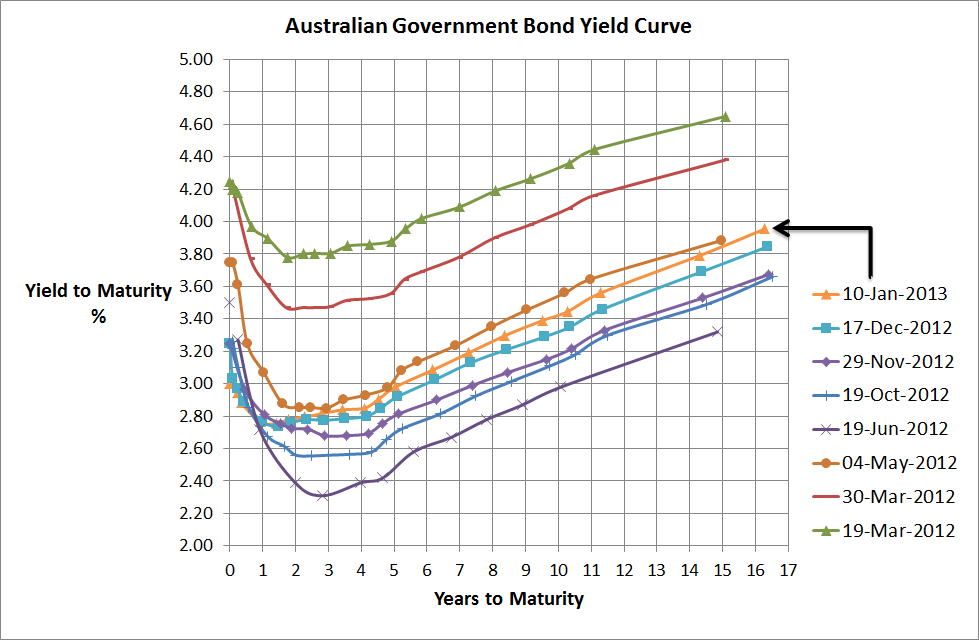
Australian Government Bond Yield Curve…still barely moving but…

Aust Government Bond Yield Curve - 10 Jan 2013

Source: RBA, Delta Research & Advisory

I had no idea that I’ve only posted twice since November, so here I am again with my favourite chart, the Australian Government Bond Yield.

As the above chart shows, over the past couple of months, yields have increased on average around 20bps across the longer end of the curve (i.e. beyond 2 to 3 years) and yields are still within the trading range that more or less commenced last May when Europe was looking grim. The UBS Composite, over the last 2 months has returned negative 0.31% so overall a pretty small decrease in the Australian bond market and what really amounts to not much more than noise.

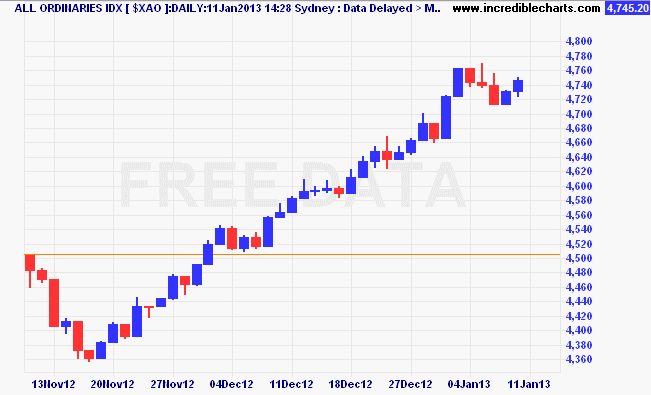
On the other hand we have the sharemarket. So whilst bonds have hardly moved our sharemarket has performed incredibly well and is up almost 10%. The chart below shows pretty much nothing but an upward trend, and this is in the face of the fiscal cliff uncertainty, poor retail sales figures, continued high savings rates, and the RBA reducing rates because of economic growth concerns (and inflation is a non-issue).

$xao_ax08nov12_to_14jan13


Source: www.incrediblecharts.com

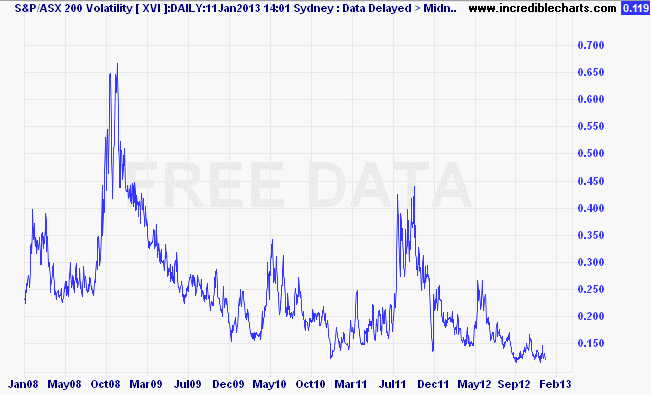
On top of that, sharemarket volatility is pretty much as low as it has been since before the GFC started. See the next chart

xvi_ax02jan08_to_17mar13


Source: www.incrediblecharts.com

Whilst there’s no doubt that the economic outlook for the major countries of the world are improving compared to a few months ago, I believe on the of the key drivers to this sharemarket performance has been the quantitative easing programs occurring around the world. Cheap money to bet on risky assets has been a popular strategy in previous QEs and its possible the main driver today.

EPS Growth - Jan 2013


Source: RBA

Personally I don’t believe the sharemarket has gone up because of company fundamentals and the above chart showing significant drop in earning expectations should support that, so there’s a good chance this market rally is more synthetic than real and when the quantitative easing stops look out for some increased volatility. Please note, this is not a suggestion to sell but more of a warning to be ready for a wilder ride than we’ve recently seen.

Dec 18

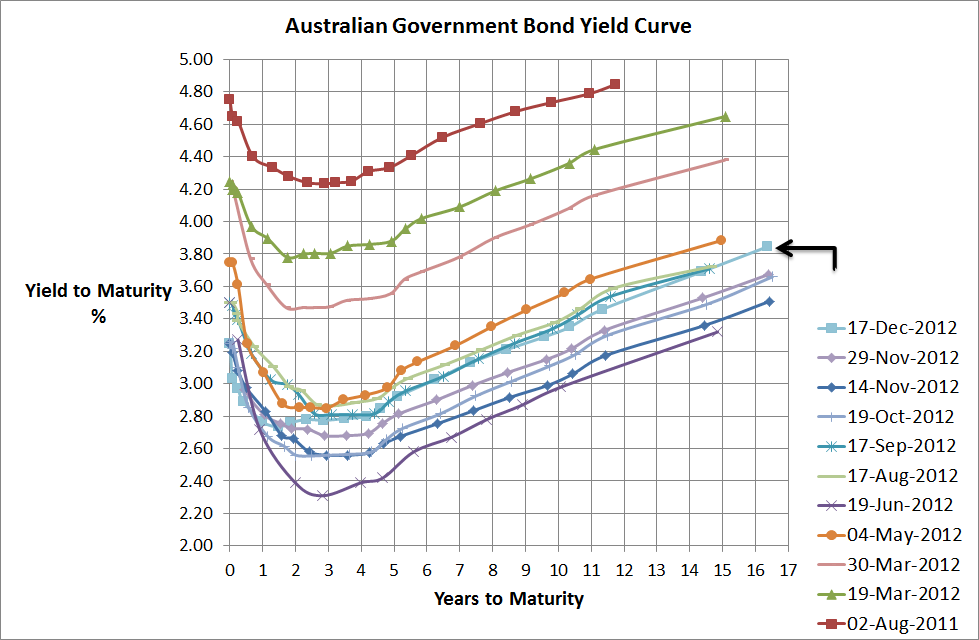
Australian Government Bond Yield Curve…maintains its trading range

Aust Government Bond Yield Curve - 17 Dec 2012Source:RBA, Delta Research & Advisory

 As the title of this post suggests, no real significant movement over the past month or since the RBA dropped its cash rate down by 25bps. The yield curve has improved marginally but overall its still within its trading range that was more or less set between May and June this year when the Euro crisis started to blow up again. Sharemarkets and bond markets have undoubtedly been calm and there has been some good employment numbers come out of the US and some mixed numbers out of China, whilst Europe continues its expected spiral into deeper depression.

Interestingly, ANZ came out over the last day or two with expectations that the RBA will drop the cash rate to 2%. Definitely possible but at this stage not even the bond market appears that bearish on the economy with current prices suggesting a reduction down to 2.5% as the more likely rate over the next 6 to 12 months.

Dec 08

Some Bond Return Distribution Stats

Source: Mornngstar Direct, Delta Research & Advisory

The above chart shows distributions of excess monthly returns over the UBS Bank Bill index from July 2000 to November 2012 for four different indexes that more or less represent the different strategies a bond portfolio can accept…

  1. Citi AusBiig 1-3 Yr index … representing short duration
  2. Citi AusBig 10+ Yr index … representing long duration
  3. Citi AusBig BBB index … representing long credit risk
  4. Citi AusBig AAA index … representing no (or not much) credit risk

Across this timeframe the Australian economy experienced concerns following the tech crash, the boom period from 2003 to 2007, and since then the credit crisis that was ultimately renamed the GFC. The credit crisis is still playing out to a degree but spreads have started to tihten again in recent times as the chase for yield is on.

The chart shows that the riskiest distribution is the long duration, 10+ Yr index, and its not surprising as 10+ years is certainly very very long in duration and the smallest spread of returns is the short duration 1-3 year index. As expected BBB shows greater risk than AAA, but what about the returns?
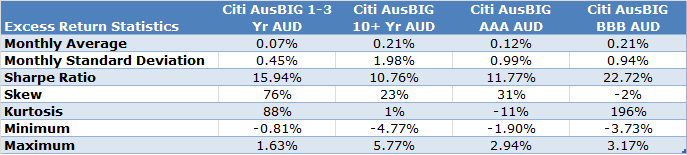
Source: Morningstar Direct, Delta Research & Advisory

The above table confirms that the long duration 10+ strategy is the riskiest, although it did have the highest monthly return average of 0.21% along with the higher credit risk of BBB. However, the higher credit risk strategy with a lower standard deviation produced the better and best Sharpe ratio. Because the volatility was so high for the long duration index, its Sharpe ratio ended up being the lowest so the return per unit risk didn’t quite cut it compared to the others.

My final however, is that return and risk are not the end of the story when it comes to fixed interest. As we know, or should know, fixed income investing is assymetric, or in English, there is limited upside and much greater downside risk. That assymetric risk is what is not in favour of the higher credit risk BBB strategy and is reflected in its negative skew whih you can see in the histograms also…the left side is a little bigger than the right side of the charts.

Anyway…these results are the past and possible reflect the potential of risk for fixed income investing today…AAA prices and the longer duration risks are probably quite high. Although its somewhat independent to the past, I do believe shorter duration, higher investment grade credit risk is likely to produce the better returns from fixed income over the next few years…assuming economic disaster does not re-occur (and that is still a possibility).




Nov 29

Investing in Asia…a wild ride irrespective of its economy

I just did an interview with Money Magazine about investing in Asia and I have to admit that it is one of the most popular requests I’ve had in recent years from advisers and/or their clients. The main reason for the request is that investors want exposure to the strong Asian economic growth story (which is really on the back of China) via their sharemarkets.

The following chart shows performance of Asia (I’ve put 2 indices – S&P and MSCI) vs Australia (MSCI) vs US (MSCI) over the last 5 years which is one of the worst periods for the US ever. The obvious observation from this chart as that there is little performance difference at all between all three regions and the US has outperformed Australia (and one of the MSCI Asian index).


Source: Morningstar Direct

For mine, if you want to invest in the sharemarket to access that particular region’s economic growth you better have a very long timeframe…I believe at least 10 years. Why? There are many reasons but short term there is little correlation between economic growth and sharemarket performance…longer term not necessarily the case…and…I’m also fairly confident that the companies listed on the sharemarket are not necessarily the ones who are benefiting from the economic growth…it is the smaller companies who possible aren’t even listed yet.

So if you are thinking about investing in Asia, I believe there are a couple of key points to consider…

  • Ensure your investment timeframe is long…ideally more than 10 years. Volatility of Asian markets can be very high for long periods of time.
  • Diversify, diversify, diversify…this is easiest done via managed funds or ETFs…and its probably the only way to gain exposure anyway…and don’t make Asia your only bet unless you are prepared to lose money
  • Don’t expected Asian markets to perform that differently from others…the above chart shows how highly correlated sharemarket are despite their different economic characteristics
  • Many Asian countries have fairly high inflation and interest rates, (such as Vietnma, Indonesia and India), and Asian markets are dominated by two major sectors…Financials (like Australia) and Technology (unlike Australia). These factors along with their expected economic growth on the back of a growing China should make for an interesting ride.

    Nov 17

    Life Expectancy Myths and Facts…and should we increase the pension age

    This week I read a couple of articles on US Life Expectancy trends that got me curious about the situation in Australia…the articles were written by Paul Krugman and Aaron Carroll and basically implied that life expectancies aren’t increasing as much as everyone thinks and if you think that the age pension age should be lifted because of these beliefs then think again.

    I managed to track down an interesting report by the Australian Institute of Health and Welfare which does go into some detail about the status of Australian health as well as an interesting section on life expectancy.
    Source: Australia’s Health 2010 – Australian Institute of Heath and Welfare

    Just looking at the above chart you can make some simple conclusions/assumptions not dissimilar to Aaron Carroll…such as

    • Life expectancy for someone at age 85 has barely moved in the last 100 years..so if you think we’re all going to live to 100 or 120 (like we occasionally hear about from the misinformed)…think again..because we’re not
    • The gap between life expectancy at age 1 and ‘at birth’ has narrowed significantly from around a 10 year difference to a fairly negligible number…this is where most of the gains in our life expectancy have been made…improvement in infant mortality
    • Life expectancy at Age 65 has improved quite significantly over the last 40 years…it has gone from an expected life to age 79-80 to age 85…a 5 year improvement…which isn’t bad.

    As a result of the 3rd point, perhaps there could be an argument for increasing the age pension starting age by 5 years…from age 65 to age 70. But since the late 1960s the age pension has gone through many changes already, most significantly, means testing has come to the fore as well as an improved superannuation system. So whilst the life expectancy for someone aged 65 is marginally better overall, I’m guessing fairly confidently that the life expectancy is biased by the wealthy (just as it is in the USA). And when you consider that the wealthier people of Australia can’t get full age pension anyway thanks to the means testing then they are already penalised.

    For the not so wealthy, I’m also guessing (like in the US) that the life expectancy for them isn’t really that different to the overall life expectancy from 40 years ago, so the argument for increasing the pension age based on life expectancy alone is probably a fairly weak one.

    Nov 15

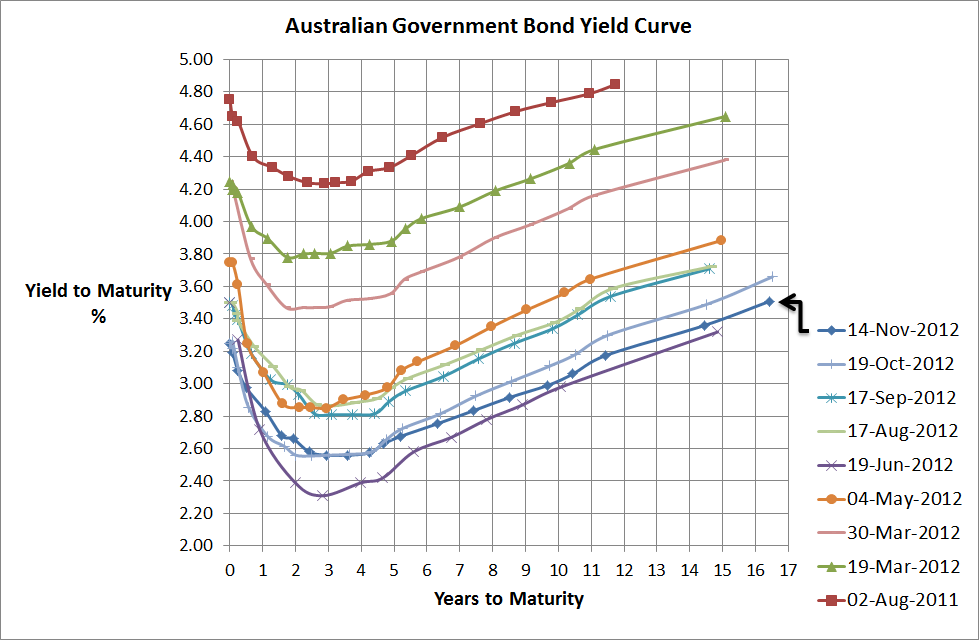
    Australian Government Bond Yield Curve…certainly not going up


    Source: RBA

    I’ve uploaded the above chart in preparation for a presentation I’m giving tomorrow on portfolio construction. Anyway, the message isn’t really a great deal different from previous posts commenting on the Government bond yield curve. Namely,

    • Interest rates are very low…you should be able to get some nice low fixed interest rates for your home loan around the 3,4, and 5 year mark
    • Inflation appears to be a non-issue
    • The bond market expects RBA cash rates to get much lower…dare I say it…2.5% within the next couple of years..to be honest, I hope not
    • The Australian economy isn’t as strong as many of us believe
    • Looks like there’s still a lot of overseas demand in these things hence why the Aussie dollar is still high

    Anyway, its not a particularly rosy picture so there’s still a few concerns around…Fiscal Cliff, China slowdown, Greek Euro Exit, Failing austerity in Europe, and middle east tensions…they’re certainly a lot more concerning than the general risks expected preceding the GFC (I say expected because let’s face it, very few of us had little idea the collapse of subprime mortgages in the US were going to start the biggest recession since the Great Depression).

    Nov 09

    Beating the Inefficient Fixed Interest Benchmark

    Its widely agreed that size-weighted fixed interest benchmarks are a poor construct when it comes to creating the optimal fixed interest portfolio. The logic from most people goes along the lines of “why would I accept the index as optimal and overweight my portfolio with the biggest issuers because they are the riskiest and more likely to default than the smaller issuers” and there is probably some truth to that.

    The amazing thing with fixed interest benchmarks is that an incredible proportion of active managers fail to outperform this so-called inefficient benchmark. According to the latest Australian SPIVA report, 92% of Australian bond funds that were around 5 years ago failed to outperform the S&P/ASX Australian Fixed Interest Index, and given that includes the GFC period perhaps we should be fair and look at more recent times…unfortunately its even worse over the last 12 months…100% failed to outperform!!!…please note performance is through to June 2012.

    So active managers struggle to beat fixed interest benchmarks so perhaps they’re not so inefficient after all, and to be honest, dare I say it, I tend to agree. I believe that at any one point in time, the market is fairly accurate at assessing the true risk/or appropriate yield of each index participant…not always but most of the time. The challenge for active fixed interest managers is not to underweight those securities that have the largest index weights…it is to invest in those securities that will outperform the rest of the market and avoid those that underperform. To do this active managers need to predict the change in risk of a company or semi-government or government debt security and this is where its difficult…predicting change in risk is tough. So whilst intuitively the largest index participants may carry the most risk because they have the most debt…if that debt is priced accurately then it doesn’t really matter because a premium is built into the price and the investor may benefit from that…the key is to avoid those that aren’t priced accurately and buy those that are. So, for example, given Italy has a very large index weight in global fixed interest benchmarks, does that mean its bad? Definitely not. Active managers who failed to hold Italian bonds when yields came down over the past few months have missed out on some decent capital growth and vice versa if they held Italian debt whilst the yields rose to their great than 6% levels in the preceding months. Predicting change in risk (after fees) is not easy and why I believe active managers fail to outperform these so-called inefficient benchmarks.

    Nov 09

    Managed Volatility…the next popular equity strategy

    There’s a brief article in today’s Investor Daily News that comments on “Managed Volatility” being the strategy to maximise returns…article here. I have to admit that I believe this strategy will be one of the new trends in equity focused managed funds over the next 12 months or so. Empirical evidence over the years the risk adjusted outperformance of broad benchmarks by value (low Price to Book), Small Companies, and Momentum styles. The latest anomaly to garner support includes low volatility; which is the outperformance of benchmarks by portfolios that remove the riskiest stocks. Apparently applying this simple methodology has worked in all markets tested across all time frames (with available data). Whilst to the lay investor this volatility anomaly may make sense (let’s face it they never really wanted the risky stocks to begin with), it actually challenges modern portfolio theory that has always suggested that high returns can only be achieved by accepting high risk…well, apparently not.

    I believe this managed volatility approach to equity investing may prove to be incredibly popular in the years to come. The attraction will be pretty simple…if the evidence suggests I can get strong equity returns with lower volatility then why wouldn’t I be attracted. Of course, once it goes mainstream I’m sure the anomaly will be arbitraged away and investors will feel duped yet again, but perhaps that’s the half glass empty researcher in me coming through.

    Either way, equity returns, lower volatility has to be attractive to the retiree looking to drawdown high percentages in these days of low interest rates…so I look forward to seeing the next low cost managed volatility index strategy…it should be a worthy contender for the diversified portfolio.

    Nov 08

    Does Value offer much Value? … this is a discussion on equities performance

    Source: MorningstarDirect

    The above chart shows the performance of the MSCI Australia Value index versus the MSCI Australia Growth index over the last 12 months (in fact through to close of trading yesterday). There’s obviously a hug divergence in performance as the Value index has returned more than 21% whilst the Growth index has barely produced a positive return at all. Who says the Australian sharemarket is all the same?

    Anyway, that is one huge divergence in performance and is primarily as a result of a chase for dividend yield in the face of historically low bond yields. The Value index is dominated by lower PE, P/Book, and higher dividend paying stocks like Telstra and the Banks. There’s definitely a slowdown in growth from China that has put downward pressure on the Growth index (which would have a reasonable resources exposure), but the question for me, is how much further can this chase for yield go? Whilst I don’t believe interest rates are going up, and I do believe high yielding investments will be in demand for some time yet, I have to admit to being a little concerned that the success of the Value index (and associated Value/Equity Income managers…Investors Mutual, Lazard, and pretty much all Equity Income strategies (Merlon, Antares Dividend Builder etc)) may well be struggling to find real value in the months to come.

    So my warning to investors and advisers is to be wary of the value and equity income manager whose success has been on the back of significant demand for high dividend paying stocks. Don’t expect that premium to continue over the next few years…sure it might…and high dividends will definitely be in demand…but beware the changing shape of what represents “value”.
     

    Older posts «

    » Newer posts