

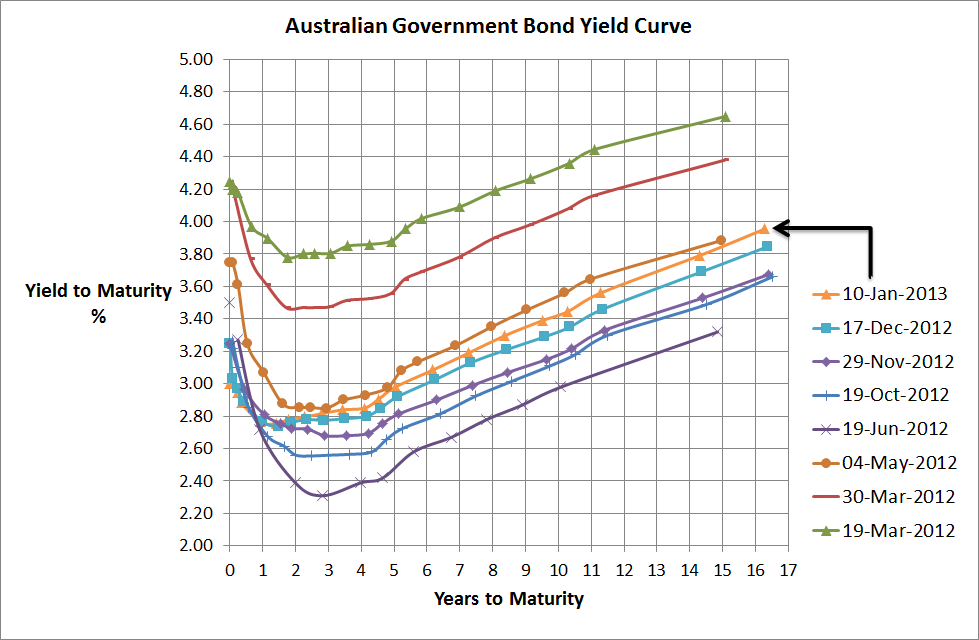
Source: RBA, Delta Research & Advisory
I had no idea that I’ve only posted twice since November, so here I am again with my favourite chart, the Australian Government Bond Yield.
As the above chart shows, over the past couple of months, yields have increased on average around 20bps across the longer end of the curve (i.e. beyond 2 to 3 years) and yields are still within the trading range that more or less commenced last May when Europe was looking grim. The UBS Composite, over the last 2 months has returned negative 0.31% so overall a pretty small decrease in the Australian bond market and what really amounts to not much more than noise.
On the other hand we have the sharemarket. So whilst bonds have hardly moved our sharemarket has performed incredibly well and is up almost 10%. The chart below shows pretty much nothing but an upward trend, and this is in the face of the fiscal cliff uncertainty, poor retail sales figures, continued high savings rates, and the RBA reducing rates because of economic growth concerns (and inflation is a non-issue).
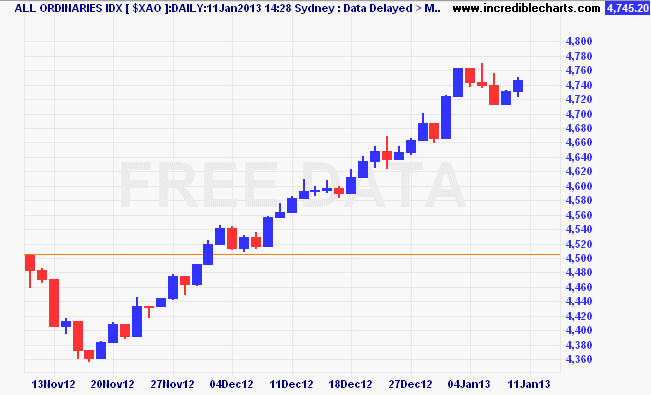
Source: www.incrediblecharts.com
On top of that, sharemarket volatility is pretty much as low as it has been since before the GFC started. See the next chart
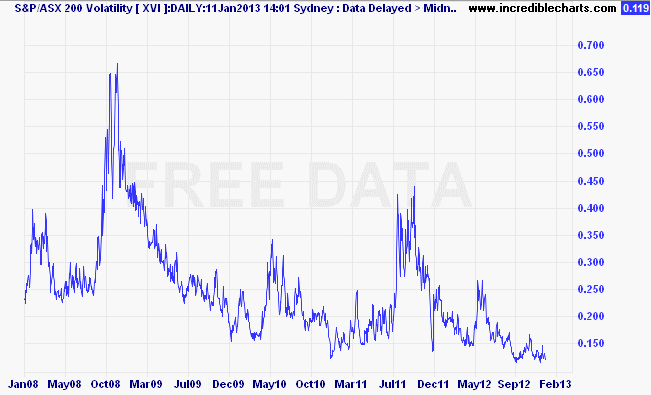
Source: www.incrediblecharts.com
Whilst there’s no doubt that the economic outlook for the major countries of the world are improving compared to a few months ago, I believe on the of the key drivers to this sharemarket performance has been the quantitative easing programs occurring around the world. Cheap money to bet on risky assets has been a popular strategy in previous QEs and its possible the main driver today.
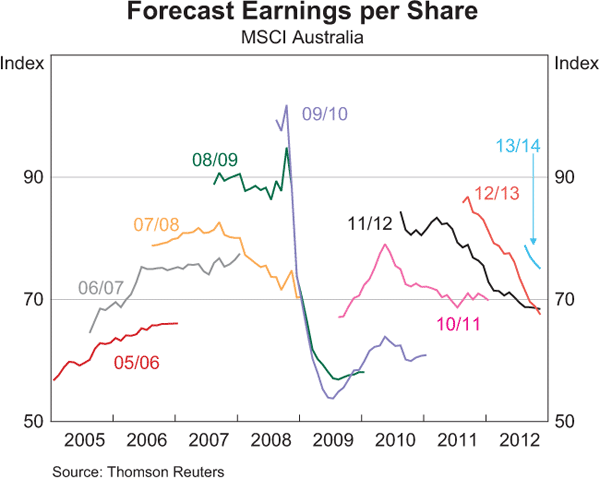
Source: RBA
Personally I don’t believe the sharemarket has gone up because of company fundamentals and the above chart showing significant drop in earning expectations should support that, so there’s a good chance this market rally is more synthetic than real and when the quantitative easing stops look out for some increased volatility. Please note, this is not a suggestion to sell but more of a warning to be ready for a wilder ride than we’ve recently seen.