Jul 27

Quick update

I’m in New York on an investment researcher’s conference and will be back in the coming days and hopefully will restart posting again!

Had a good session a few days ago with a great presentation on how low volatility stocks have produced outstanding long run investment returns over many years…should be an index product on that. Anyway, will report more hopefully next week.

Jul 19

Alternative equity an alternative to cash???

Oh dear. I just read the above headline in the Money Management daily…click here…and the stated reason is…

they deliver reliable income streams and protect capital in volatile markets

…I don’t think so or more to the point, with no where near the ability of cash. It looks like the S&P analyst is referring to Variable Beta managers as they have rated them highest in the sector and he believes they are unjustly “unpopular”. I’ve written about Variable Beta funds before and believe they could have a place in portfolios but suggesting they are a potential replacement for cash is downright dangerous and negligent.

Cash is a safe haven. Its to be used for a rainy day, a little bit of income, because you think interest rates are going up and because you may need to draw some out today or tomorrow, and because you do not want to take any short term risk. Variable Beta funds may or may not have sharemarket exposure and they may or may not have a lot…plus…you never actually know how much exposure they have at any one point in time…therefore, you may lose money and you may lose a lot…you purely rely on the skill of market timing and pay pretty high fees for the privilege.

I don’t really care how good the manager may be, to suggest alternative equity is a potential replacement for cash because it pays consistent income is wrong and you can never have the same capital protection at low cost like cash.

Jul 10

Australian Government Yield Curve…little change recently

Source: RBA

Its been a few weeks since I posted my last Australian bond yield curve but nothing’s really changed. I guess its even true when it comes to the economics of the world…China’s data is mixed and not as strong as once expected; US continues to produce mixed data including more weak employment data; and the Euro crisis continues with little sign of anything but delaying what is looking like an inevitable Euro exit from more than just Greece.

It still continues to be a very difficult investing environment. Bond yields at record lows; volatile sharemarkets; and an economy under some pressure such that property doesn’t look so attractive either. Term Deposits continue to provide significant returns above the government bond yields so continue to be the most attractive investment for the moment.

Jul 08

Sovereign Bond Allocation

Chart 1

Source: Trading Economics

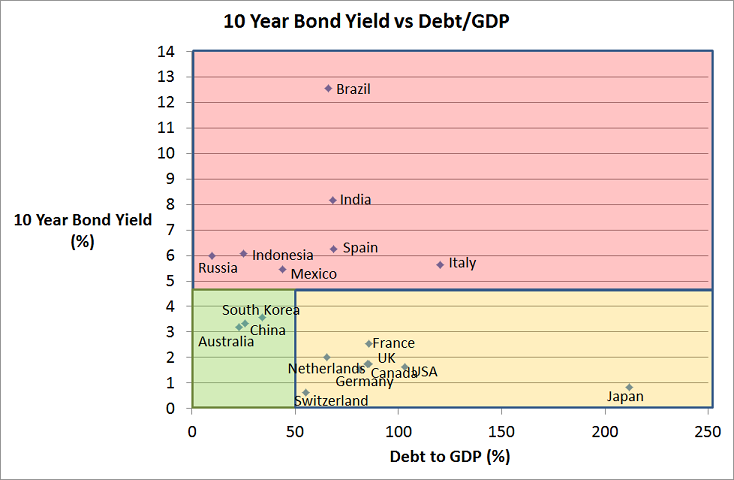
The above chart shows the 10 year bond yield versus the Debt/GDP of the 10 largest countries in the world by GDP (Except Turkey whose bond data is missing). The chart is divided into 3 sections…

  1. Red section…countries with high 10 year bond yields
  2. Orange section…high debt levels but low bond yields
  3. Green section…relatively low debt levels and bond yields

The countries in the red section are there because they have a history of default (e.g. Russia and Mexico) and there is probably an in-built credit risk associated with them; countries with currently high inflation (e.g. Brazil and India) and their bond yields are a reflection of this; and countries who are facing significant default risk (e.g. Spain and Italy). This is the red section because buying these sovereign bonds come with higher risk and potential instability.

The orange section does not show any strong signs of default risk which is really a result of their low interest rates which makes it relatively easy to sustain these debt levels indefinitely. The big risk for these countries are if interest rates start to climb. These countries are all facing deflationary issues, with Japan being there for many years already.

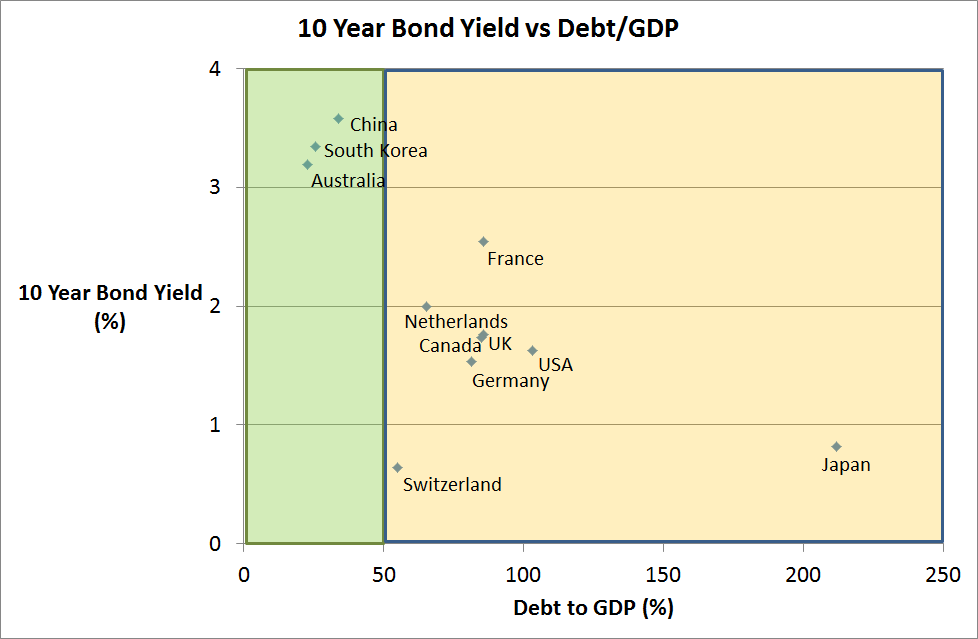
Finally the green section contains three countries that don’t pose too many risks at all from an investing perspective. Australia, China, and South Korea each have relatively low levels of debt but, interestingly, as Chart 2 shows they also have high interest rates than all countries in the orange section. Each of these three countries also appear to have the strongest economies.

Chart 2
Source: Trading Economics

The point I’m looking to make here, is that Australian bonds, despite their record low yields, do appear to be amongst the most attractive if not the most attractive place to allocate your safety capital. The yields are higher than most of the overseas safe havens plus this higher yield probably comes at the lowest levels of default risk.

Many superannuation and financial adviser portfolios have a significant allocation to Global Fixed Interest and the index exposure is popular. Unfortunately, the index construction of bond funds is deeply flawed and allocations are to those countries with the greatest amount of debt. The top 3 countries are USA, Japan and Italy….so what you get is low yields from US and Japan (and therefore significant interest rate risk), and high default risk from Italy.

Whilst most of this data is old news, it still makes a case, albeit simplistic, for an overweight position to Australian bonds in the defensive part of a sovereign bond portfolio.


Jun 27

Australian Equities Style Investing – Value vs Growth

Its been over a week since I posted so I thought I’d write about something that is a little bit different and hopefully may provide a little bit of food for thought.

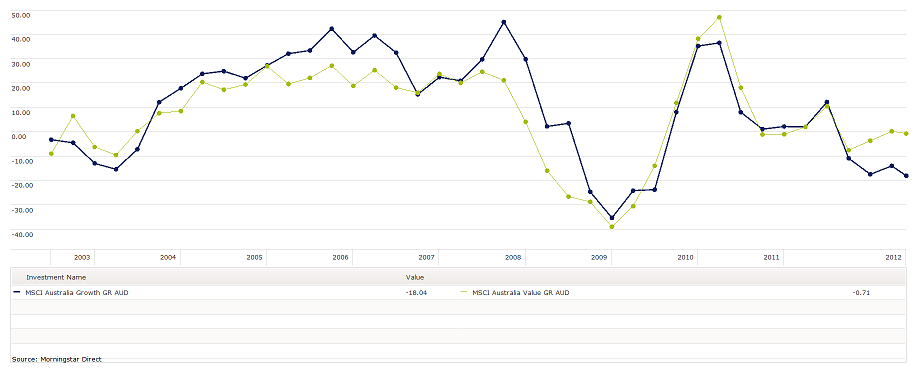
The above chart shows the performance of the MSCI Australia Value index (dominated by low PE stocks) vs MSCI Australia Growth index (dominated by strong earning growth stocks) over the last 10 years. Each dot point is three months apart and represents the 12 month performance of the respective index. What the chart shows iis that over the last 10 years the MSCI Australia Growth index has mostly outperformed the value index, surprisingly including during the Lehman Brothers period of 2008/09. I say surprising because often it is the Growth stocks (i.e. those with a higher earnings growth performance and expectation) that will fall the most as growth projections are downgraded .

Despite the dominance of the growth index over the 10 years, the last 18 months to 2 years has seen a significant divergence between the two indices and the Value index has massively outperformed Growth. In the 12 months to the end of May 2012, the performance of the Value index is only just negative (-0.71%) whereas the growth index is a disappointing loss of more than 18%.

There is a belief by many that the Australian sharemarket is too small to differentiate between value and growth stocks, but given the recent divergence in performance I’m not so sure…anyway…

So what? you may ask.

Well, this divergence explains why certain fund managers are top of the league table why others are at the bottom and it is the fund manager’s style bias that has recently been more important than any actual stockpicking or timing skill. For example, my analysis shows that Lazard Australian Equities is amongst the top performing Australian equities managers because it has embraced the Value style but unfortunately its “Alpha” over recent years is negative…so in my mind they haven’t produced sufficient skill to justify their fees. On the other hand, Macquarie High Conviction has shown a strong bias towards the Growth style and after this bias is taken into consideration there has been a positive alpha (or skill) according to my statistical analysis so there is an actual value add there worthy of consideration….however, because of their style leaning to growth stocks, they have been one of the worst performing Australian share managers over the past 12 months.

Ok…so…the point of this is that style matters and can matter more than skill and should be a consideration in terms of your market expectations and how you would like to position your investment portfolios. For me, I’m expecting sharemarket volatility to continue and I believe there is a strong chance that growth forecasts may continue to decline so I am currently favouring the value style over growth. The next questions I need to ask are…which managers actually implement a value style, are likely to continue that style, and have the ability to pick the stocks that can justify their fees?

Jun 19

Australian Government Bond Yields…a little lower still this month

Source: Reserve Bank, Bloomberg

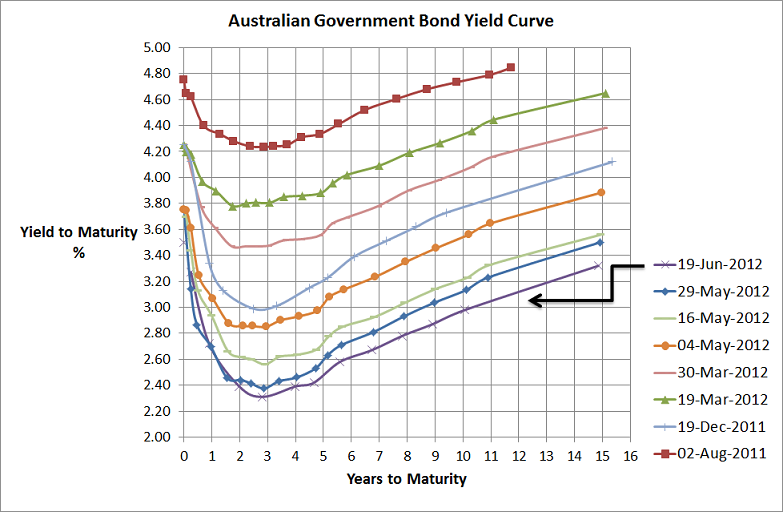
I’ve placed this chart on my website more as a reference for an upcoming presentation I’m giving than for any real message it conveys. Basically not too much change…yields are slightly lower than they were at the end of May but they increased a little from a couple of weeks ago and when you consider the continuation of Spanish problems with their record high bond yields (10 year bond yield was trading at a yield of 7.08% around 8.30 AEST) then low yield curve is no surprise. Anyway, sharemarket volatility and global economic uncertainty will be themes for some time yet and the bond markets are pricing in a few more RBA rate cuts too.

Jun 18

So much for the Greek election…Spanish bond yields getting ugly

Source: Bloomberg

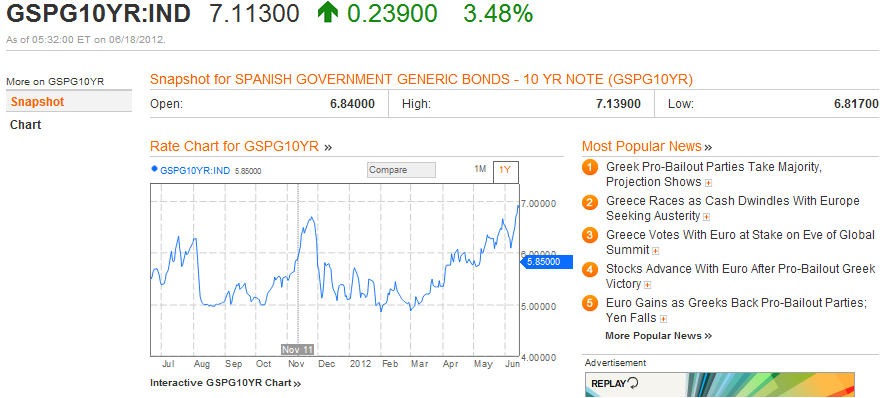
Spanish bond yields are a far greater concern than Greece…Greece’s exit from the Euro unfortunately is inevitable and the Pro-Austerity victory in the election will just create a delay for, hopefully, an orderly exit from the Euro.

With Spanish 10 year bond yields now above 7%, which are completely unsustainable levels, another bailout will undoubtedly be required soon from the Troika, that is the IMF, European Central Bank, and the European Union, and the saga will continue until the next problem…probably Italy (at least their 10 year bond yields are only a smidgeon above 6%)

Anyway, European sharemarkets have declined quite quickly after a little bit of post-Greek-election euphoria. The half life of market euphoria following decent news is getting shorter and shorter.


Jun 12

So much for the Spanish bailout…yields are heading higher

[table id=1 /]

So much for the Spanish bailout… Their 10 year bond yields are heading back up towards 7% and Italian 10year bonds are over 6% and trending up.

The half life of any temporary bailout appears to be getting shorter and shorter…not that European equity markets care too much…they’re up a little bit at the moment. Obviously if these yields continue there’ll have to be more bailouts and I’m afraid there is no endless money supply from the troika. No doubt thee bank runs will continue across all of the peripheral countries…mmmm…not too sure when these problems will end or how it will end.

Jun 10

Infrastructure in an investment portfolio…diversification benefits?

Recent years has seen increased interest in infrastructure being included in investment portfolios. The justification goes that, infrastructure assets provide steady income streams linked to inflation from large, often monopoly assets (like toll roads, airports and the like), with long lifetimes that can reduce the capital volatility.

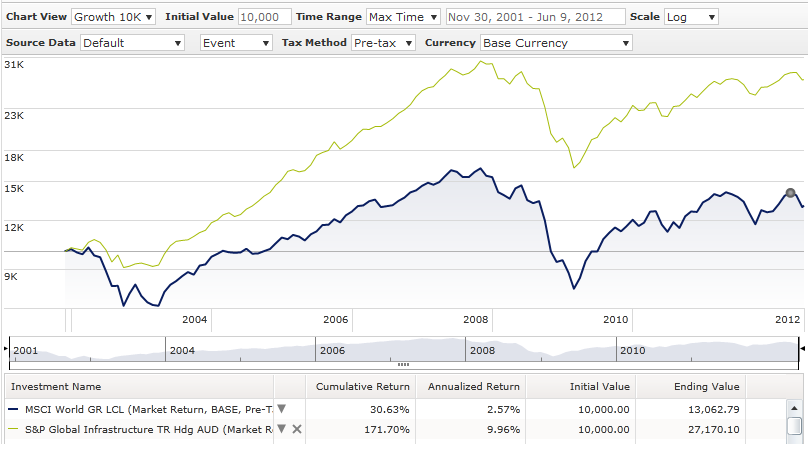
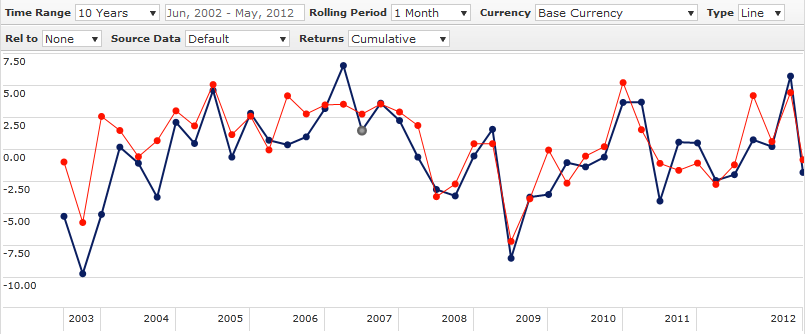
As the following ten year chart shows, global infrastructure (represented by the S&P Global Infrastructure index) has certainly outperformed global shares (represented by MSCI World GR index)…both asset classes are in Australian dollars and are unhedged to make an apples and apples comparison…but…the question is, does this past performance actually support the justification?

Source: Morningstar

To more closely examine Global Infrastructure I created 3 risk factors that are generally accepted as providing superior sharemarket returns…i.e. the market premium (MSCI World minus UBS Bank Bill); Value Premium (MSCI World Value minus MSCI World Growth ); and Small Cap Premium (MSCI World Small Cap minus MSCI World Large Cap)…using the statistical technique, OLS Regression, i then regressed these 3 risk factors against the risk premium that Global Infrastructure has provided (S&P Global Infrastructure minus UBS Bank Bills). All analysis was done in Australian dollars effectively removing currency effects that hedging one asset class might have.

This 10 year regression analysis yielded the following results for Global Infrastructure…

  • Market beta of 0.69…this means there is outperformance in bear markets but underperformance in bull markets
  • A very slight value premium…significant at a ~89% confidence level
  • No small or large cap bias, and
  • Very slight alpha…again significant at around the 89% confidence level
These relationships explain around two-thirds of the return variability so its a decent model. My interpretation of these results are that the jury is still out as to whether there is any true added value from global infrastructure, I’m surprised infrastructure doesn’t have a stronger value bias given its supposedly higher dividends (which aren’t too much more than 3% so nothing truly flash) and at this stage,  global infrastructure is primarily a low beta play on the global sharemarket …so if the global sharemarket market runs strongly, be prepared for disappointment.
Despite these results, I do believe they justify the inclusion of Global Infrastructure in portfolios. Because it is highly correlated with global shares (~0.8 plus also see below chart), it definitely should be regarded as a growth asset and should not replace the more defensive fixed interest allocation.
Source: Morningstar (Red line = S&P Global Infrastructure; Blue line – MSCI World GR)

Jun 07

Great GDP result…though we’re still a multi-speed economy

I know I’m a day late with this but anyway… like everyone I was absolutely shocked at the sensational GDP result that came out yesterday. Since August last year the bond market has been moving in a direction that indicates our economy is not what it seems but nevertheless the 12 months to March 2012 shows real GDP in excess of 4%…truly amazing. Now I know the bond market has been bought up by a massive number of foreign investors but the shape of the yield curve doesn’t lie, and its been short term negative signalling some type of weakness.

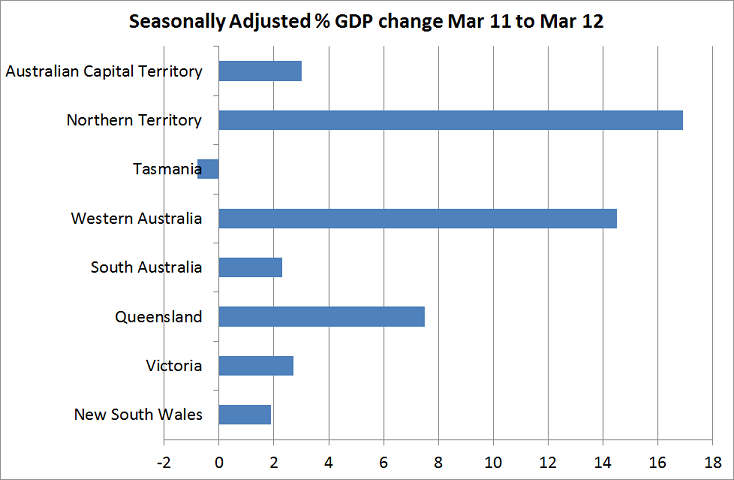
But despite the great national result, when you break it down there are clearly significant pockets of weakness. The biggest driver of the GDP result is thanks to the resources sector and when you look at the state’s results, it supports this fact but it also shows that our GDP growth as a nation is really only driven by 2 states…Queensland and Western Australia…I guess Northern Territory too but its quite small in comparison.

Source: Australian Bureau of Statistics

As you can see, Queensland, Western Australia and Northern Territory really shot the lights out with the latter two showing double digit growth. Also, Queensland would have received significant growth hit from the flood and cyclone rebuild so there is a (hopefully) one-off impact in there that shouldn’t be forgotten.

If you look at the other states…nothing too flash. Tasmania is in recession and our two biggest states by population, NSW and Victoria, have growth only around 2%,give or take…in fact NSW was negative for the quarter.

So our economy, has definitely been reliant upon our resources sector for economic growth. Despite that, the resource sector has been a laggard in our sharemarket…why so? Well the sharemarket is a forward looking or leading indicator and I guess the sharemarket is forecasting that China’s growth is slowing and things aren’t quite as rosy for resources as they once were…do’t get me too wrong…its still relatively rosy…but its all relative and the outlook for resource profit has diminished.

Anyway, the multi-speed economy is stil in play and the RBA didn’t drop rates for the wrong reason last Tuesday…it dropped them because

the Board judged that, with modest domestic growth and a weaker and more uncertain international environment, the outlook for inflation afforded scope for a more accommodative stance of monetary policy

Older posts «

» Newer posts