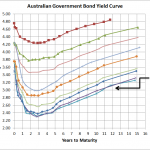
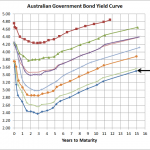
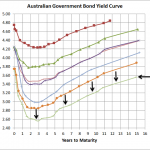
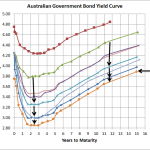
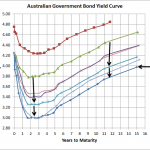
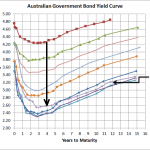
Source:RBA The above chart shows that over the last few weeks there has been an increase of around 10-25bps across the yield curve which is also in line with the marginally stronger equity markets. As I’ve stated numerous times before, the European situation is what is currently driving most major market moves and the partial …
Tag Archive: fixed interest
Jul 10
Australian Government Yield Curve…little change recently
Source: RBA Its been a few weeks since I posted my last Australian bond yield curve but nothing’s really changed. I guess its even true when it comes to the economics of the world…China’s data is mixed and not as strong as once expected; US continues to produce mixed data including more weak employment data; …
Jul 08
Sovereign Bond Allocation
Chart 1 Source: Trading Economics The above chart shows the 10 year bond yield versus the Debt/GDP of the 10 largest countries in the world by GDP (Except Turkey whose bond data is missing). The chart is divided into 3 sections… Red section…countries with high 10 year bond yields Orange section…high debt levels but low …
Jun 19
Australian Government Bond Yields…a little lower still this month
Source: Reserve Bank, Bloomberg I’ve placed this chart on my website more as a reference for an upcoming presentation I’m giving than for any real message it conveys. Basically not too much change…yields are slightly lower than they were at the end of May but they increased a little from a couple of weeks ago …
Jun 01
Negative Interest Rates Anyone?
Australian Government Bond Yield Curve – 1 June 2012 – 4.06pm Source: www.bloomberg.com The 3 year Australian government bond is currently 2.06%…this is truly extraordinary. When you throw in the fact that Germany, USA, and Switzerland also have record low bond yields its really looking like a serious run for safety…but major equity markets haven’t really moved …
May 30
Australian Government Bond Yields…setting new records
Source: RBA I know I’ve written more posts on the Australian Government Bond Yield than ever but with the yield curve hitting record lows its pretty hard to ignore. The above chart shows where the yields finished yesterday and today they’re lower again. The European situation is definitely the main driver as funds move to …
May 18
Australian Government Bond Yields…continue record lows
Source: RBA In less than 2 weeks the Australian Government Bond yield curve has dropped another 20bps plus and since August last year, the yield curve has dropped around 160bps on average…which means for bond fund owners double digit returns over the previous 12 months continue. Obviously the main reason for this drop in yield …
May 07
Australian Government Bond Yields…supports the dumb budget
Source: RBA As the above chart shows, the yield curve has dropped 70 to 90bps for all terms since March 19. With a 3 year bond yield just above 2.80%, which is close to where it was during the worst of the GFC, its pretty obvious markets aren’t too confident in the strength of our …
Apr 30
Australian Government Bond Yield Curve…new lows
Source: RBA I know its just a week and a half since I last provided an Australian Government Bond Yield curve update but over this time the curve has dropped another 20-25bps to mostly be below the bottom from 19th December. This is largely on the back of weak inflation data…deflation if you look at the seasonally …
Apr 24
No wonder Term Deposits are popular…annuities too
Source: RBA, Comminsure, Challenger Life, RimSec The above chart is pretty strong evidence as to why investors are placing their money into term deposits and annuities…very very attractive margins over government bonds. As you can see, at the 5 year term the interest rates for term deposits and annuities are almost double! When you consider that …


