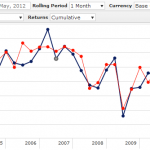
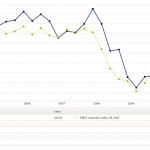
Its been over a week since I posted so I thought I’d write about something that is a little bit different and hopefully may provide a little bit of food for thought. The above chart shows the performance of the MSCI Australia Value index (dominated by low PE stocks) vs MSCI Australia Growth index (dominated …
Category Archive: Investment Strategy
Jun 10
Infrastructure in an investment portfolio…diversification benefits?
Recent years has seen increased interest in infrastructure being included in investment portfolios. The justification goes that, infrastructure assets provide steady income streams linked to inflation from large, often monopoly assets (like toll roads, airports and the like), with long lifetimes that can reduce the capital volatility. As the following ten year chart shows, global infrastructure (represented …
Jun 01
Negative Interest Rates Anyone?
Australian Government Bond Yield Curve – 1 June 2012 – 4.06pm Source: www.bloomberg.com The 3 year Australian government bond is currently 2.06%…this is truly extraordinary. When you throw in the fact that Germany, USA, and Switzerland also have record low bond yields its really looking like a serious run for safety…but major equity markets haven’t really moved …
May 30
Australian Government Bond Yields…setting new records
Source: RBA I know I’ve written more posts on the Australian Government Bond Yield than ever but with the yield curve hitting record lows its pretty hard to ignore. The above chart shows where the yields finished yesterday and today they’re lower again. The European situation is definitely the main driver as funds move to …
May 20
Being a millionaire may not be enough for a comfortable retirement
Source: Delta Research & Advisory Pty Ltd The above chart shows the probability of running out of funds in retirement for someone who retires with $1,000,000 in today’s dollar and draws $55,080 each year (ASFA Retirement Standard for a comfortable retirement for a couple), growing at 3% inflation. It is assumed the funds are invested …
May 07
Australian Government Bond Yields…supports the dumb budget
Source: RBA As the above chart shows, the yield curve has dropped 70 to 90bps for all terms since March 19. With a 3 year bond yield just above 2.80%, which is close to where it was during the worst of the GFC, its pretty obvious markets aren’t too confident in the strength of our …
Apr 16
Retirement Income Portfolios – poorly understood
One of the debates in the financial services media has been around the investment strategy of superannuation funds and whether they are holding too many equities. In the camp of too many equities is former Head of Treasury, Ken Henry, nd former Chairman of the Future Fund, David Murray; and opposing views have typically been …
Mar 27
Does our Super have too much in equities?
Over the last couple of weeks I’ve been asked to comment on the asset allocations of default super funds. There’s certainly been a very interesting debate through the print media which was probably started by David Murray, Chairman of the Future Fund, last year when he stated that Austrlaian Super Funds were too heavily invested …
Mar 20
Australian Government Bond Yields…approaching normal
Well…not normal yet. The shorter part of the curve suggests the market is expecting another two 25bps cuts by the RBA but with the Euro sovereign crisis well and truly looking much better its highly unlikely there’ll be any cuts soon. Whilst there’s plenty of evidence that shows the Euro sovereign crisis has improved, nothing …
Mar 06
Australian Bond Yields…still edging up
Source: RBA I know the above chart is a couple of days old but there’s not much change since last Thursday. At its simplest what it shows is that the bond market is still expecting the Reserve Bank to decrease interest rates some time during the year…with 1 year bond yields at less than 4%, …


