I’m writing this on Boxing Day and unlucky me is recovering from Covid for the second time in 2022 (Week 1 and Week 52) and during this first sentence I think I have sufficient energy to write a few thoughts on cryptocurrency…so here it goes…
Two or three years ago I was on stage at an investment conference and was asked about the viability of investing in Bitcoin. And I think its worth adding that this has been one of the most frequently asked questions of me over the last few years. I responded along the lines that it was an asset without cashflows, similar to gold, but unlike gold there is nothing tangible behind it, underneath it, or anywhere else … so basically you are buying a lot of nothing for what appears to me to be a fairly high and somewhat random price that makes little sense. Given my belief that Bitcoin is nothing, it didn’t appear an appropriate investment for portfolios … or at least not appropriate unless you are prepared to lose all of your money for the possible trade-off of continued irrational positive price momentum versus my perception that it is actually nothing. Of course, the value of cryptocurrencies skyrocketed after that making me look a little silly … even if I didn’t believe it did.
Since that conference, I have come to learn that cryptocurrencies, like Bitcoin, are not “nothing”. In fact, at their most basic, cryptos are potential currencies where various risk-taking individuals, companies, and even one country (that I’m aware of) do have trust in them and are prepared to accept cryptos as legitimate currency. But, as we have seen for a number of years now, cryptos are so price volatile that they are not particularly “good” currencies as a “good” currency should not be (too) volatile. Any currency that is too volatile means you have little idea what your true purchasing power is today let alone tomorrow and in some countries high currency volatility has often led to the collapse of their local currency (and they’re often, at least temporarily, replaced by the world’s reserve currency, US Dollar).
Whether a good currency or not, because they lack cashflows (or an associated interest rate) it is very difficult, if not impossible, to determine a valuation of crypto. This is largely because assessing the value of any cryptocurrency is an exercise in valuing a purely intangible asset … which is similar to valuing currencies such as US Dollars, Euro, etc. except at least you can receive a known interest rate for holding different currencies. Either way, valuing an intangible asset may be absolutely fine except for one very major thing. That intangible value is probably not much more than trust …. and unfortunately for them, cryptos are not currently accepted as currencies by governments (particularly the big governments that matter …e.g. USA, China, Europe, et al.). So, their intrinsic value is significantly diminished by the lack of trust by governments. To me, this also results in an intrinsic value that should be valued less than government issued currencies. So if $1USD in Cash has the same purchasing power today of 1 crypto-dollar (whether bitcoin, dogecoin, or whatever), the crypto-dollar should actually be worth less than $1USD because of its higher price volatility (proxy for risk) and the existing lack of trust in crypto compared to $1USD.
OK … but what about the most powerful and probably most overlooked characteristic of cryptocurrency that to be fair, it has been a major selling point since the start … i.e. the value of decentralized transactions? That is, cutting out the fee gauging middleman … whether banks, lawyers, financial advisers, exchanges, et al. The blockchain, that cryptocurrencies are built on, allows “secure” (as far as I know) peer-to-peer transactions that bypass the banks (& other middlemen) and go direct to the payee’s account … meaning potentially fast, cheap transactions. Brilliant! … there has to be value in that. And it also means secret transactions as there is no reporting by the middleman to the tax department (or other government departments). However, as appealing as secret transactions are, this secrecy and decentralisation is likely part of the trust problem that cryptos have, because governments can’t see the transaction occurring…so it appears its major benefit (decentralized finance) actually adds to it’s major problem (lack of trust).
That said, decentralisation and “secret” transactions does mean crypto’s intrinsic value should always have some value as these characteristics are somewhat appealing to many (particularly the black market and/or criminals) where lack of transparency for governments is and always will be very attractive. So, whilst I suggested that cryptocurrencies were a whole lot of nothing … that’s not really true, as there is some intrinsic value or benefits for many.
Oh yeah … I’ll take this opportunity to clear up a potential misperception … this opaque, potentially cheap, peer-to-peer transaction is all due to the blockchain which is the “secure” technology making cryptocurrency possible … but it’s essential to understand that when you buy cryptocurrency, you are not buying the blockchain technology, you are merely a temporary passenger in the blockchain transport (or transaction) system and there is no ownership of blockchain. At the end of the day (or transaction), when you buy cryptocurrency, you are buying stuff that is not trusted by governments, has limited value, but provides the potential for cheap peer to peer transaction (and anecdotally I hear it’s not that cheap but I’ll leave that for others to decide).
So what has happened recently. Well, this latter half of 2022 we have started to see a few nefarious outcomes of this crypto craze. The cryptocurrency exchange, FTX, has gone bankrupt likely owing billions, with several of its executives likely to go to jail for many years due to alleged fraud. FTX’s problems have flowed into other crypto businesses that are likely to go bankrupt given FTX owed them money, not to mention the many crypto investors that used FTX and now have lost a lot of their assets. In Australia we have seen the closure of several crypto managed funds, including some who thought they could run a fund without a license (AFSL). And there’s a lot more blowing up in crypto land that I don’t have the energy to write down today. Anyway … I have to point out the obvious … all of these crypto disasters just mentioned are the middlemen!!! The very participants in the finance world that cryptocurrency was supposed to rid us from … i.e. exchanges, managed funds, advisers, et al. Instead of ridding us from middlemen, crypto has done the complete opposite and brought in more middlemen including quite a few dangerous ones. Why? This cryptocurrency bubble appears to have increased the crazy, unethical, immoral, middlemen because there is little to no regulation; Because cryptocurrency investors generally think the price always goes up; Because cryptocurrency was perceived to have so much value when the likely reality is that it is just an expensive, volatile peer-to-peer transaction system, built on a peer-to-peer blockchain system (except the high energy required bit) that not too many fully understand or yet trust.
Sadly, cryptocurrency has been mis-sold as a currency or asset that will always appreciate. It has little to no trust as a legitimate currency, has little intrinsic value as an asset, and from what I can tell and frequently hear (so happy to be wrong on this last part), requires way too much energy and risk to the planet to mine new coins. And now it looks like its appearance on the finance websites of the world is coming to an end. All of that said, there will be much to learn from the recent cryptocurrency experience as it has brought a number of finance problems to light (e.g. high middlemen costs, transaction costs, et al.) and has flirted with some solutions. For those out there looking to buy crypto because they perceive them as cheap, I believe it is best to avoid; and for those who are looking to sell, it may be best to cut your losses (or take the gains) and go. But then, what do I know … I certainly didn’t predict its ascendancy.
Disclaimer … I do not know your personal circumstances so this should not be accepted as financial advice and is simply an opinion that may or may not be appropriate for your personal circumstances (which I think I just mentioned that I did not know!)
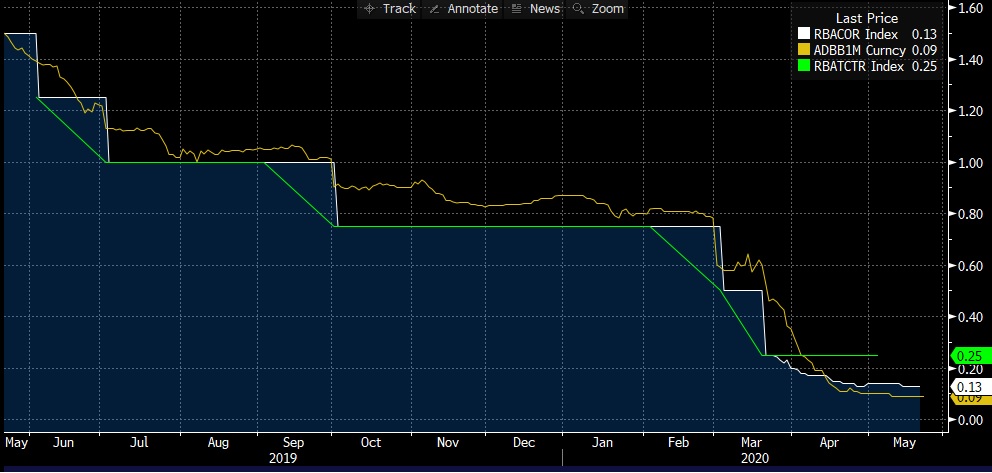
 Source: Bloomberg
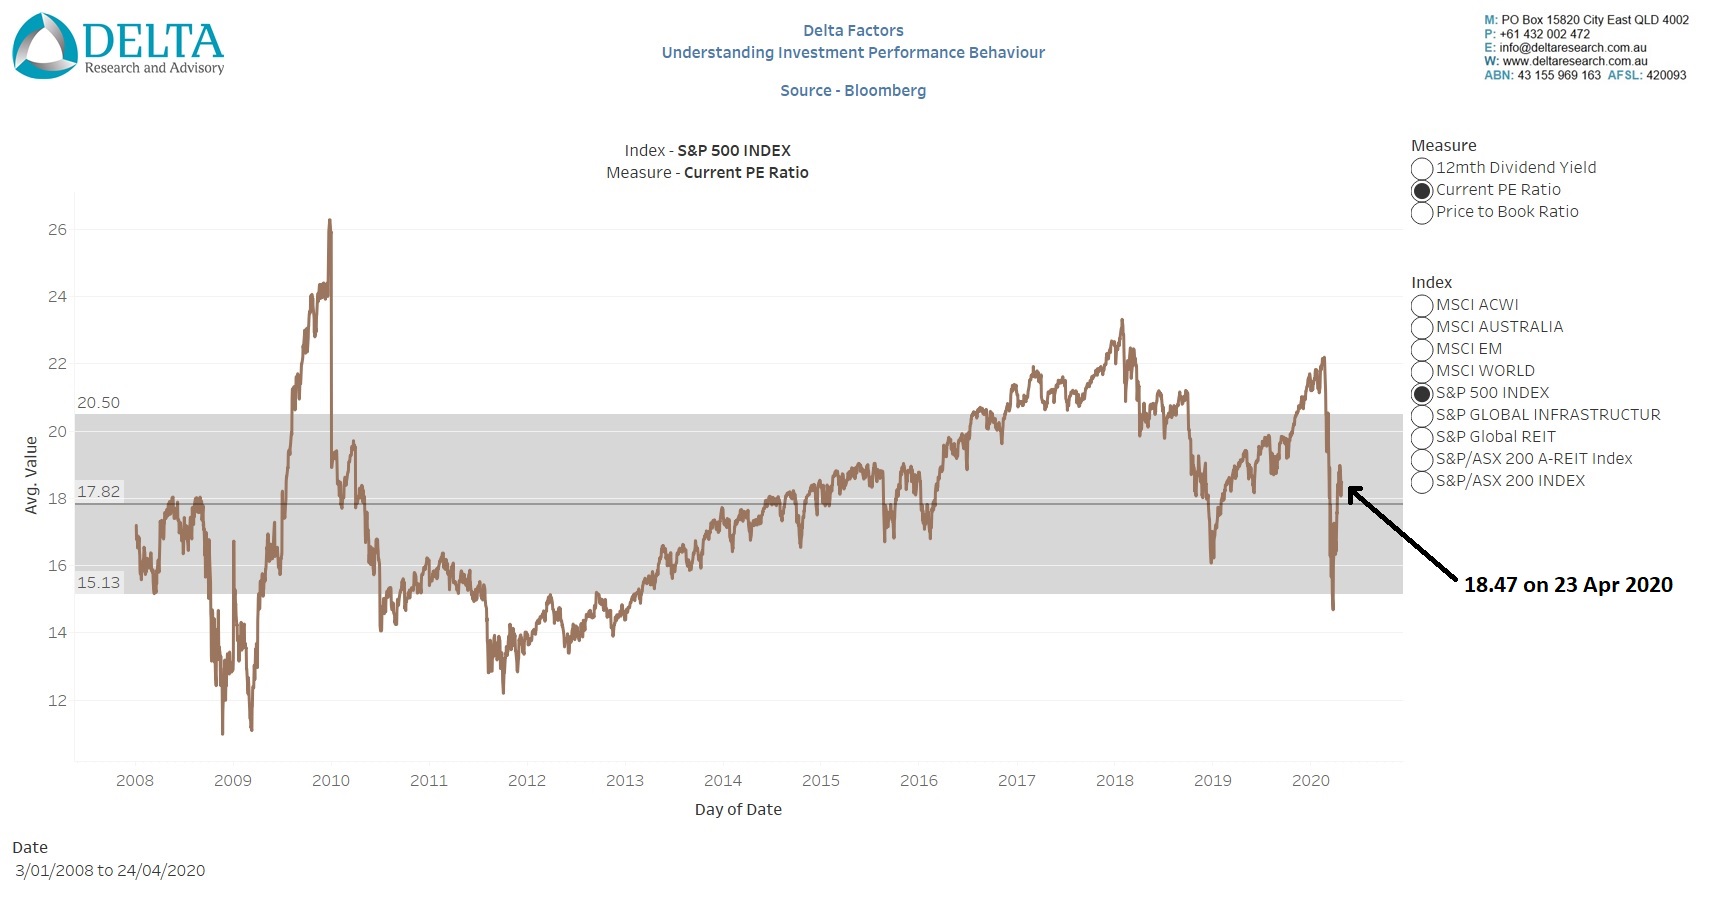
 Source:
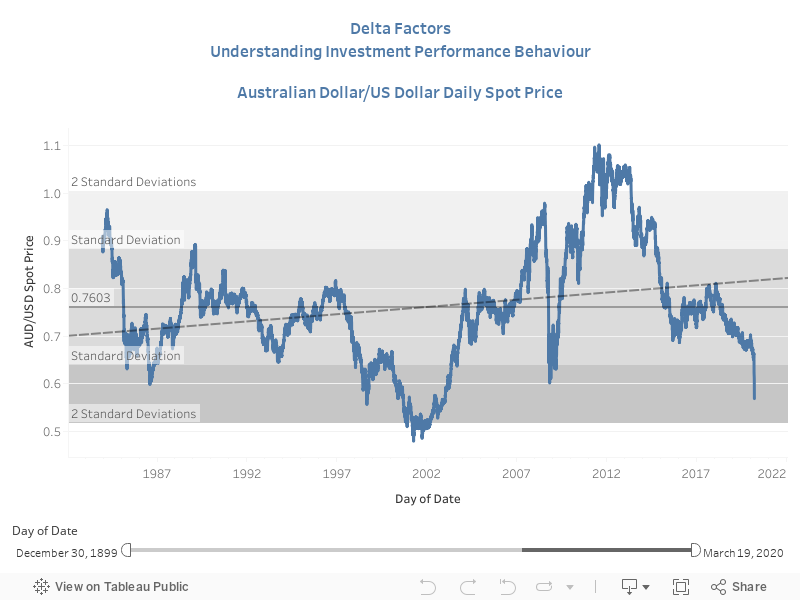
 Source: Bloomberg
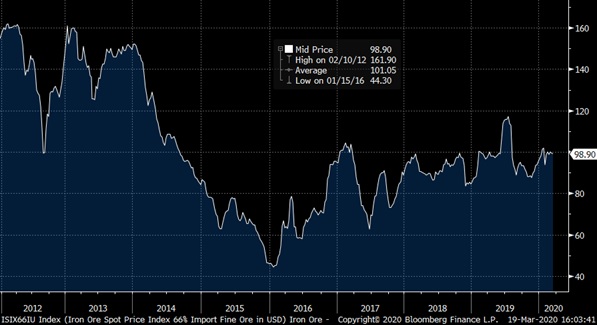
 Source: Bloomberg