

 Source: Delta Research & Advisory
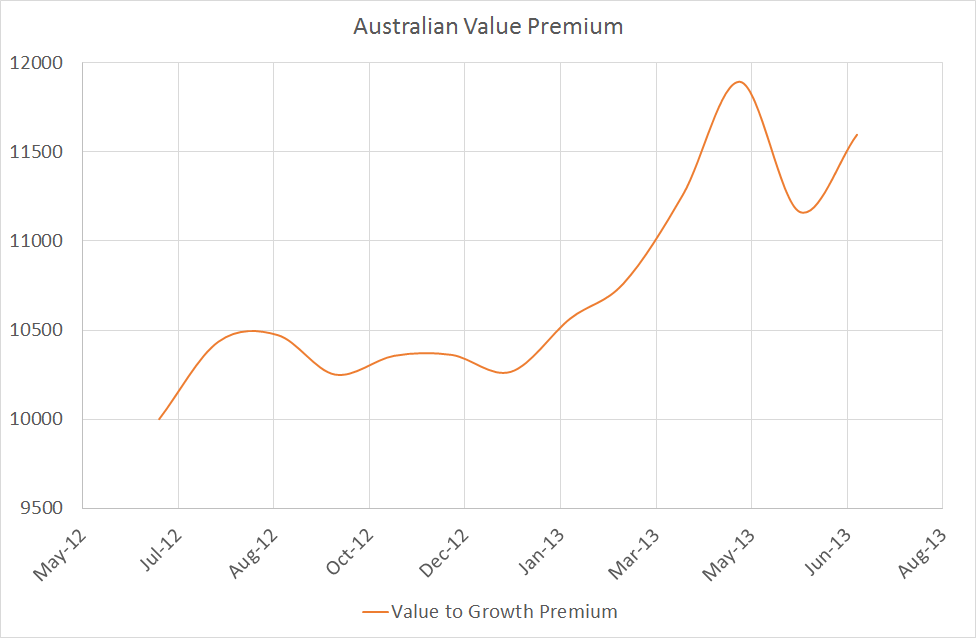
The above chart shows the performance of the value risk factor, which is simply calculated as the performance of the MSCI Australian Value index minus the performance of the MSCI Australian Growth index. With an ending value great than 15% than the starting value, clearly the 2013 financial year was a great year if your style was “value” biased. When you consider the “chase for yield” theme given low interest rates, this should be unsurprising as the MSCI Value index contains a strong bias towards high dividend paying stocks. So if you bought the ASX200 index you would have received a little more than 22% for the year to June 2013, plus if you were 100% long the value index and shorted the growth index you would have received another 15% to provide a stellar return of 37%…so it probably makes sense that the best performing Australian share managers of 2013 financial year probably had this value bias…surprisingly that’s not necessarily the case.
Source: Delta Research & Advisory
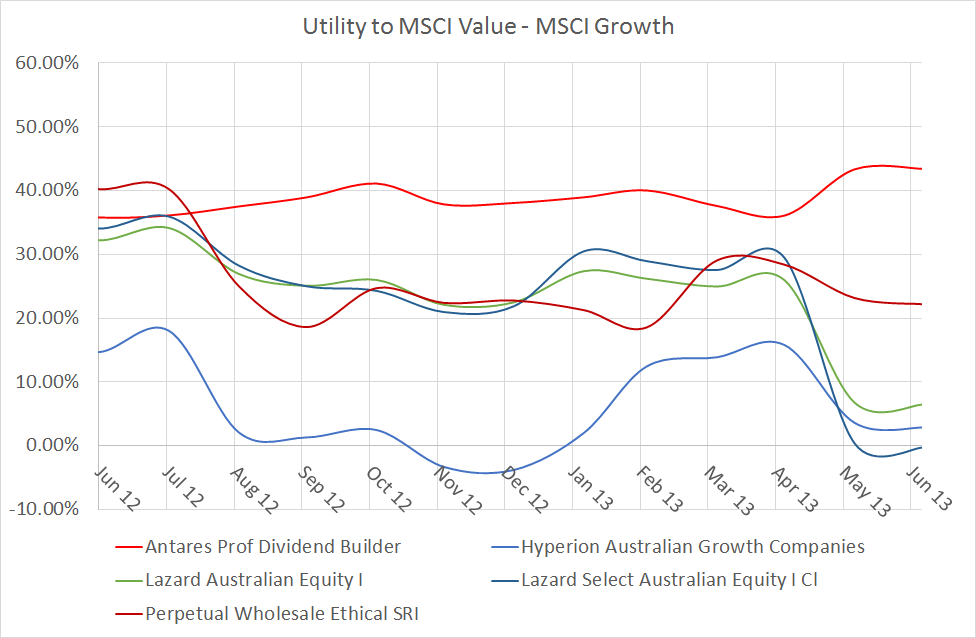
The above chart shows the managers who are most exposed to “value”. Each line represents their rolling 3 year utility to the value premium and what is most interesting is…
- The Lazard funds, Hyperion Growth (they may need to rename), and to a lesser degree Perpetual Ethical all rode the value wave until May and reduced their exposure to value which was excellent timing as the value premium went backwards over the last 2 months of the financial year.
- Hyperion doesn’t appear to be a value manager necessarily but the shape of its Value exposure appears to be well-timed compared to the pure performance of the value premium as they both accelerated from January.
- Not surprisingly the Antares Dividend Builder has the highest exposure to Value…but its exposure was not diminished over May and June and that would have really hurt it…in fact it lost more than 8% in May alone…ouch!
Source: Delta Research & Advisory
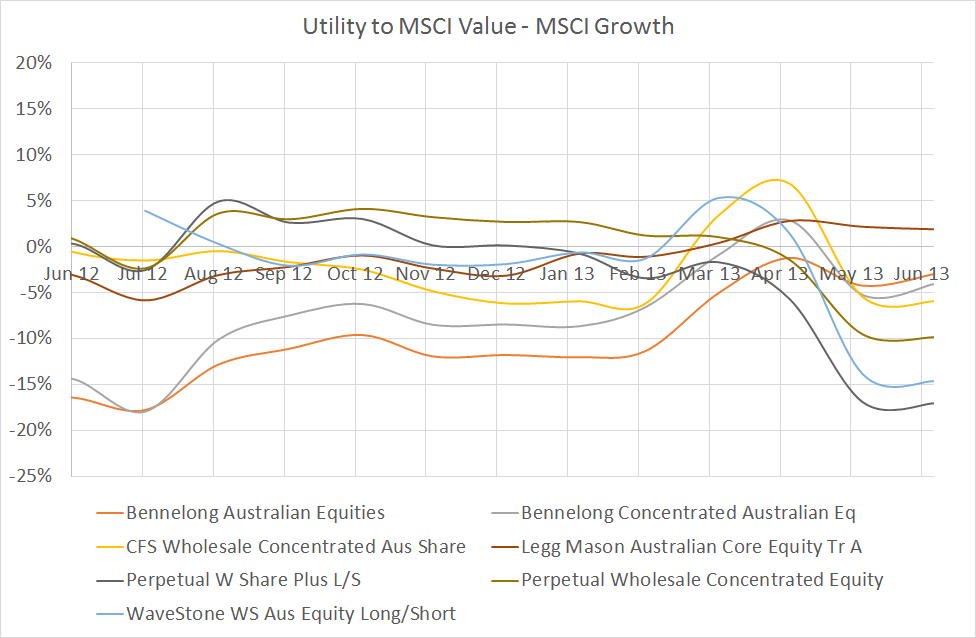
The remaining funds (or at least the ones with sufficient performance history assuming I could get it…so nothing on Tyndall, sorry Luke, or UBS Halo, short timeframe there) don’t really have a strong value bias at all. Despite a different title to the second chart in this post, the final chart shows more of a growth bias (Bennelong) or no bias at all (everyone else). These are the funds that have really relied on their stockpicking skills, luck, or other drivers of performance as their style bias has not helped at all.
The surprising results here include…
- Just because its Perpetual doesn’t mean it has a “value” style
- the fact that more of the top funds do not have a “value” bias despite a cracker of a “value” year
- quite a few of these funds appeared to have sold off their “value” holdings similar to Lazard and Hyperion
To be honest I’m not really sure what I’ve learnt from this analysis so i’ll leave it to you to decide.
Anyway my disclaimer once again is, under no circumstances am I recommending or not recommending any of the above-mentioned investments to the reader. Their recent strong performance could easily reverse as could their above-mentioned styles. If you do choose to invest in any of these funds and they don’t work out…don’t blame me!!!