

Background
According to (Elroy Dimson, 2010) the “conventional view Is that, over the long run, corporate earnings will constitute a roughly constant share of national income, and so dividends out to grow at a similar rate to the overall economy. This suggests that fast-growing economies will experience higher growth in real dividends, and hence higher stock returns”.
Unfortunately, empirical evidence showing positive relationships between economic growth and sharemarket returns has not been as strong as many have expected and there are many examples, where high economic growth has coincided with terrible sharemarket returns. Emerging Markets and China are possibly one of the better examples of this relationship breakdown in recent years.
The purpose of this article is to revisit the relationship between economic growth and sharemarket returns. Whilst much of the literature, including on this subject focuses on the US, the data presented in this paper also includes Australia and United Kingdom. Why Australia and United? … A couple of reasons and both somewhat naïve. Firstly, they are spread geographically with different major trading partners, and secondly, they were the regions which enabled easiest access to long term data.
Data Sources
For the analysis that follows, all equity market returns are accessed from MSCI database, are calculated in local currency (i.e. AUD for Australia, USD for USA, and Sterling for UK), and data series commence 31/12/1969. The specific indices are MSCI Australia GR, MSCI UK GR, and MSCI USA GR.
Real GDP figures come from each country’s central bank data sources. That is, Reserve Bank of Australia, Bank of England, and Federal Reserve. Please note, at the time of writing Real GDP figures were not available for the December 2016 quarter for either Australia or USA.
Quarterly Analysis
Equity Returns vs Real GDP
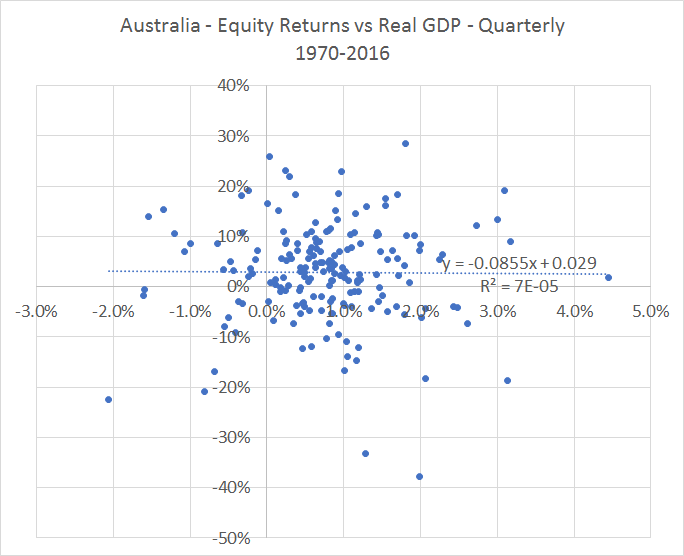
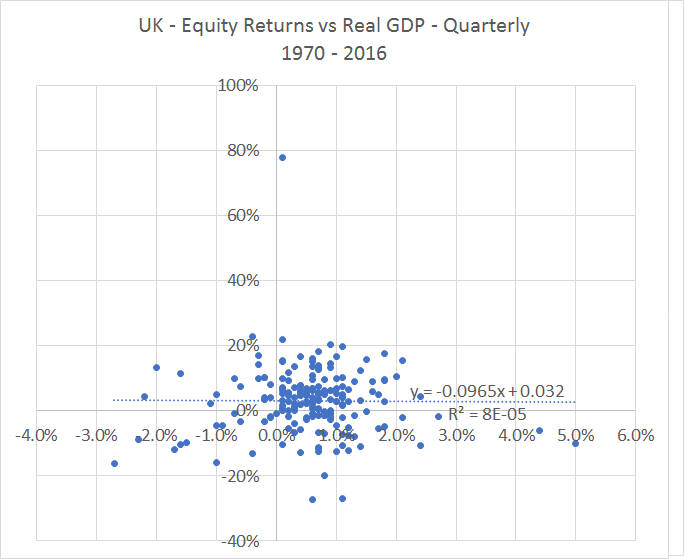
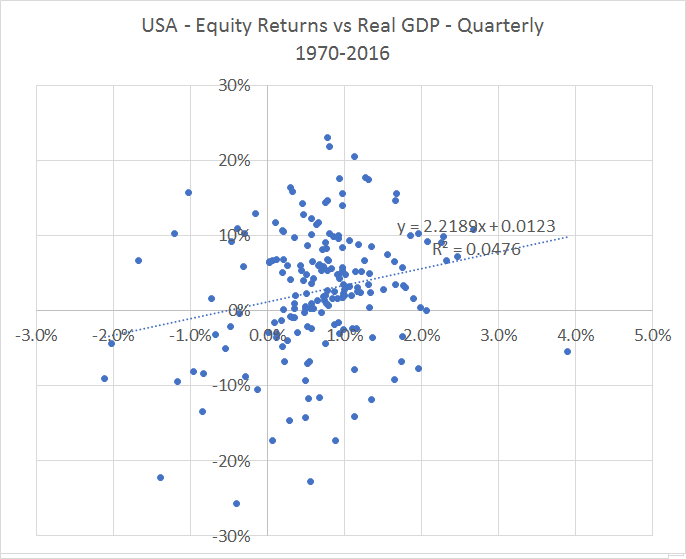
Let’s start with a direct comparison of equity returns and real GDP using quarterly data for each country. Figures 1,2, and 3 show the results for Australia, UK, and USA, and only USA shows any relationship. Both Australia and UK show no relationship between equity returns and the same quarter Real GDP results at all…this is supported by the flat trend lines and the R2 result being close to 0.
The USA Trend suggests that for every additional 1% in quarterly Real GDP Growth it correlates with an additional ~2.2% in quarterly equity market returns. With an R2 of less than 5%, Real GDP does produce a great deal of explanatory power of equity returns, but the slope s highly statistical significant given it’s t-statistic is 3.04.
This suggests that of the three countries, if you can predict the quarterly GDP in advance then it might provide a slight edge in the USA only … it doesn’t necessarily help in Australia or the UK.
Figures 1,2, and 3 – Quarterly Equity Returns vs Real GDP for Australia, UK, and USA;
Figure 4 – Regression results for Figure 3’s trend line

Source: Delta Research & Advisory
Is the Sharemarket a leading indicator?
For many the potential spurious relationship between quarterly equity returns and Real GDP is unsurprising because the belief is that the sharemarket is more of a leading indicator, meaning that its direction is a forward predictor of future economic growth. The initial test for this is done by comparing the last period’s equity market returns to the current period real GDP.
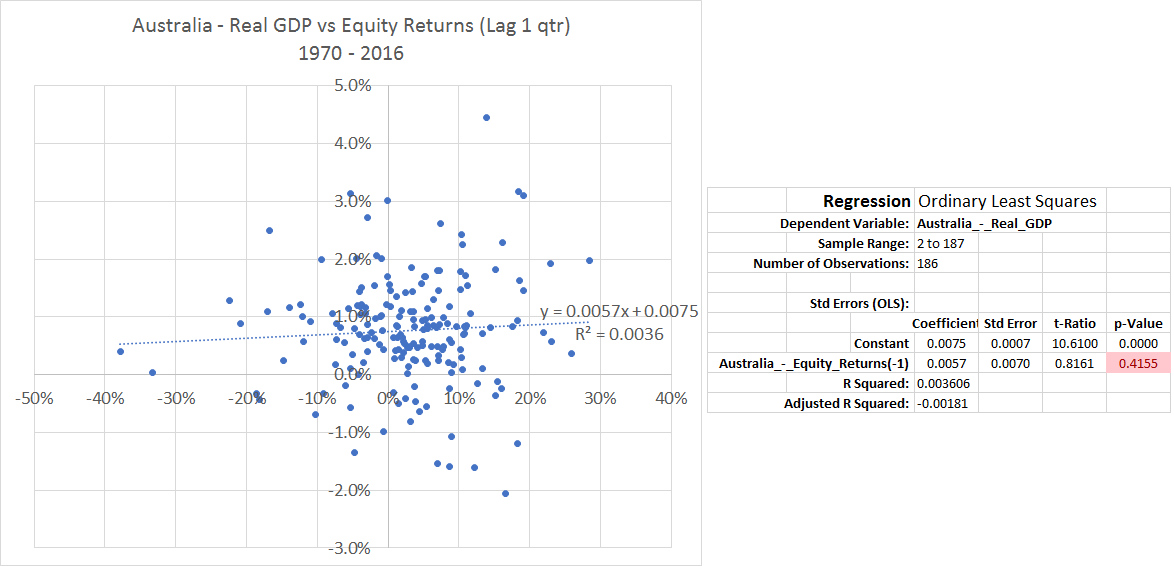
The charts and results are shown in Figures 5,6, and 7. Once again, only the USA show a statistically significant trendline suggesting that last quarter’s equity market return might be a leading indicator for this quarter’s Real GDP. That said, the US Equity market return only explains around 10% of the variance in the next quarter’s Real GDP so there is a lot of unexplained variance due to other factors, which should not be surprising.
Neither Australia nor UK show a statistically significant relationship for last quarter’s sharemarket returns being predictive of this quarter’s Real GDP result.
Figures 5,6, and 7 – Quarterly Real GDP vs Equity Returns (Lag 1 Qtr) for Australia, UK, and USA; and accompanying regression statistics
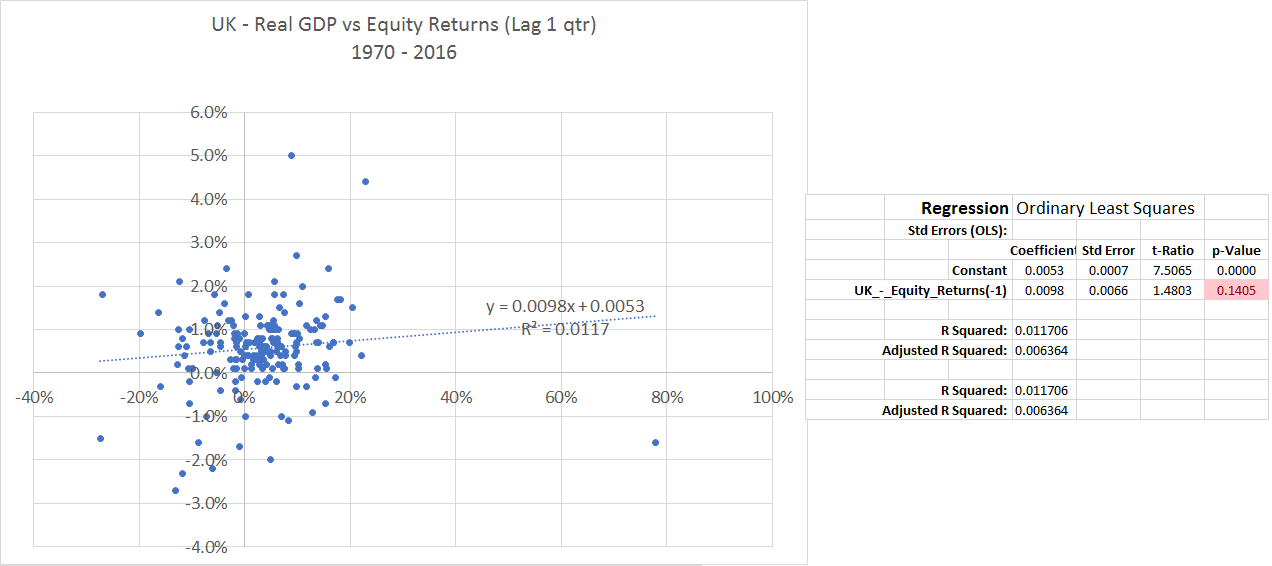
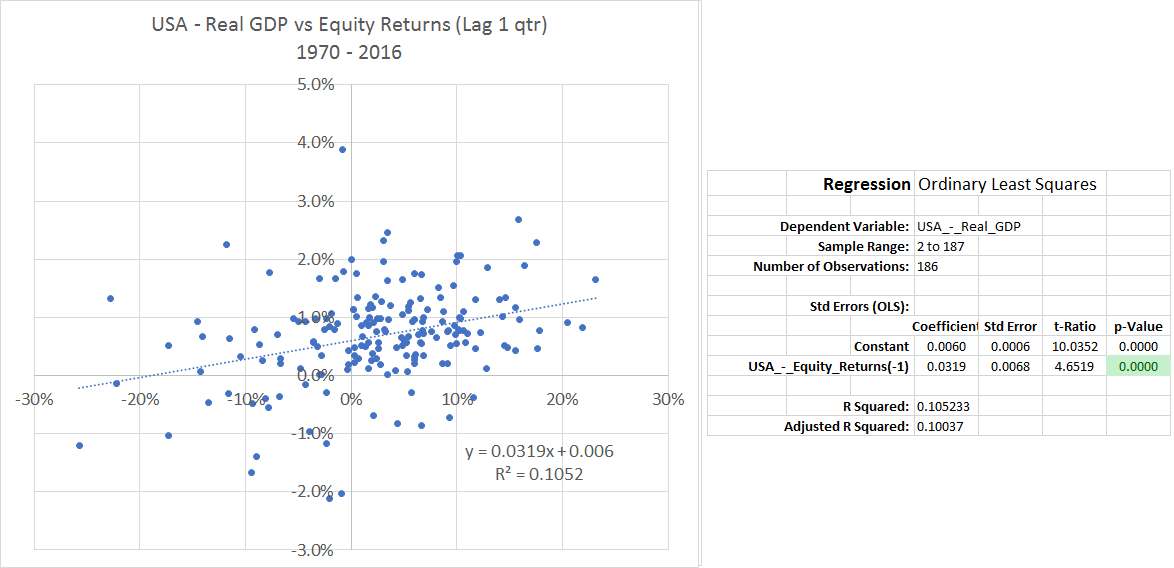
Source: Delta Research & Advisory
Stretching out the Timeframe … Annual
So far we have looked at quarterly data only and many might argue that it is longer run economic growth that is important to sharemarket returns because quarter-to-quarter can be potentially meaningless due to volatility and the associated uncertainty or potential lack of obvious trend.
Figures 8,9, and 10 show the relationship between annual returns and annual Real GDP and the only significant trend is for the USA. The relationship between annual equity returns and annual Real GDP appears insignificant for both Australia and the UK.
Figures 8,9, and 10 – Annual Equity Returns vs Real GDP for Australia, UK, and USA;
Figure 11 – Regression results for Figure 10’s trend line

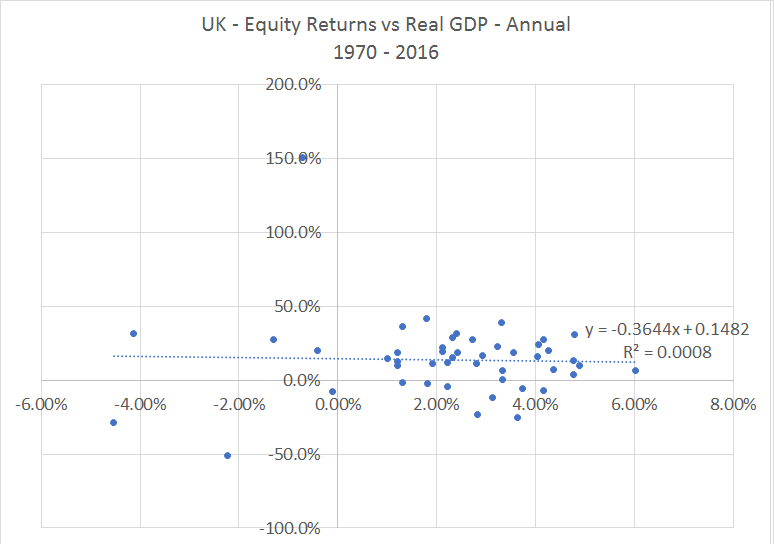


Source: Delta Research & Advisory
Interestingly compared to the quarterly results from Figures 3 and 4, there is greater explanatory power in the regression model. Whilst quarterly Real GDP explained around 10% of the variability of quarterly equity returns in USA, annual Real GDP explained more than 28% of the annual equity market variability in USA between 1970 and 2015.
These results show only a stronger relationship over longer term, once again, for USA.
Sharemarket as a Leading Indicator?
So is this year’s sharemarket return likely to provide an indication of next year’s Real GDP Growth? At the quarterly level, there appeared to be potential evidence suggesting the sharemarket might be a leading indicator in the USA only but at the annual level? It is the reverse result. That is, the relationship between lagged annual equity returns and real GDP growth is strong for Australia and the UK and weak for USA…refer Charts 12 through to 14.
In Australia, for every 10% in annual equity returns has meant next year’s Real GDP growth has been 0.383% higher. For the UK, that relationship is similar whereby every 10% in annual returns meant it’s Real GDP was 0.312% higher the following year. Still with R2 of only ~23% and ~15% respectively, there is still a lot of unexplained Real GDP variability as you would expect.
Figures 12,13, and 14 – Annual Real GDP vs Equity Returns (Lag 1 Yr) for Australia, UK, and USA; and accompanying regression statistics


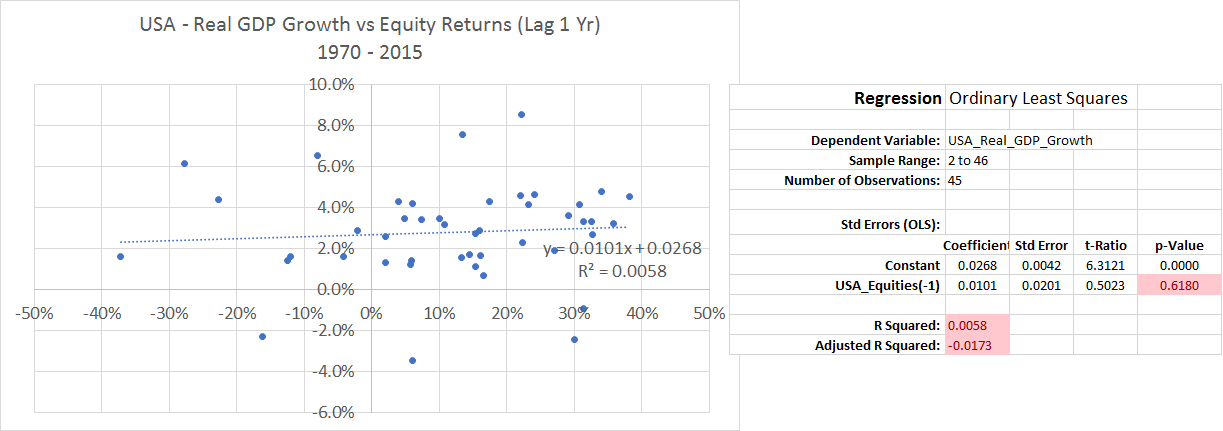
Source: Delta Research & Advisory
Down the Final Stretch
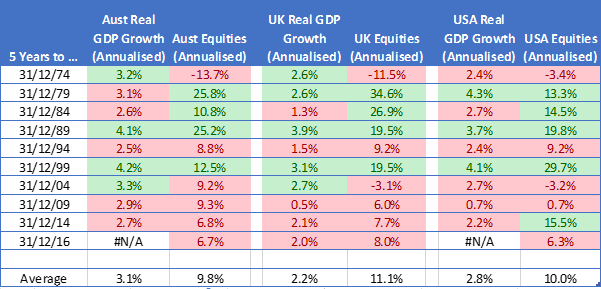
The final analysis looks at 5 Year data. Statistical tests on this small sample size can be fraught with danger so a table of Real GDP and Equity Returns is presented in Figure 15 below. As mentioned above, all equity returns are calculated in local currency terms; red cells indicate below average results and green cells indicate above average results.
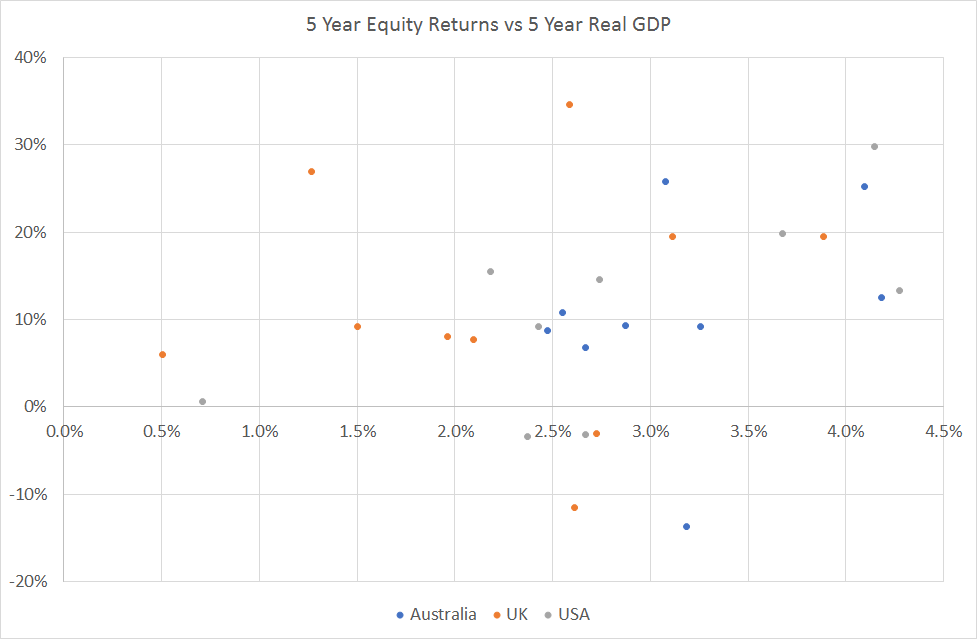
Overall there does appear to be some potential patterns. The Scatter Plot (Figure 16) shows that 5Year periods of above 3.5% Real GDP Growth coincided with double digit equity returns for all 3 countries, whilst Real GDP Growth averaging below 1%pa produced a couple of single digit annualised equity returns. Real GDP Growth between 1%pa and 3.5% pa … no obvious pattern.
Of course, this analysis is a little simplistic as it starts at a fairly random start date, i.e. when the equity returns data commence, and hasn’t explored beyond this one possibility.
Figure 15 & 16 – Five Year Real GDP and Equity Returns for Australia, UK, and USA
Source: Delta Research & Advisory
What does all of this mean?
It is important to point out that the analysis in this paper is simplistic insofar that it only looks at quarterly versus quarterly, annual versus annual, 5 yearly versus 5 yearly and considers quarterly and annual lags in equity returns to see if the sharemarket is likely to be a leading indicator. There are many other timeframe permutations that could be tested and the analyses presented in this paper provides no indication as to the true impact of economic news or sharemarket news or the ability to predict stronger or weaker economic outcomes will have on equity market return predictions.
Most importantly, there does appear to be a relationship between Real GDP Growth and Equity returns. There is, however, a big question mark as to what that relationship is because what has been shown in this paper is that the relationship differs between country and across different timeframes and lags.
The sharemarket might be a leading indicator for future economic growth and the ability to predict economic future growth might help predict future equity market returns. But, there are still very large risks of failure involved. At the risk of stating the obvious, there are many other factors to consider, and whilst this paper doesn’t address or compare, valuation metrics are still likely to be a critical factor in the future equity return expectation. That said, whilst the ability to predict future economic growth might not always help in predicting equity market success, it still may provide an edge from time to time.