Source: van Eyk
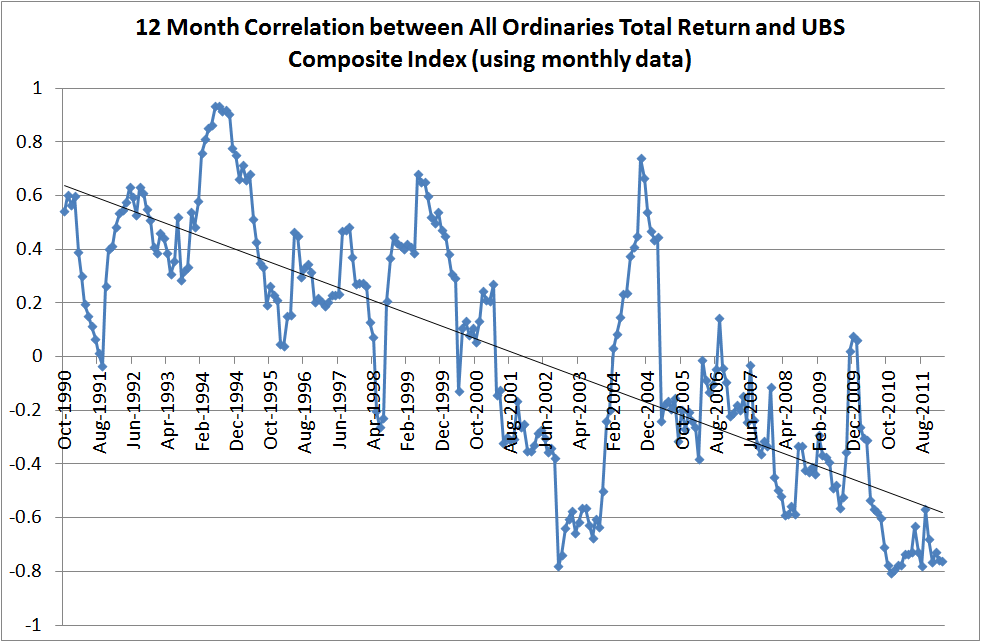
The above chart shows the 12 month correlation of monthly returns between the UBS Composite index (representing Australian Fixed Interest) and the total return of the S&P/ASX All Ordinaries index (Australian shares). As you can see the correlation between both asset classes is extremely variable and the trendline shows that over the last 21 years or so, the correlation has declined from being fairly positive to quite negative.
To me, the most obvious observation of this chart is that the lowest correlations occurred during times of sharemarket/economic stress…so that includes the 1991 recession we had to have, the disastrous markets of 1994, the Asian crisis of 1998, the tech wreck from 2000 to 2003, and most recently the 2008/09 GFC, and the current 2011 Euro-Sovereign crisis.
Modern Portfolio Theory is largely about diversification and the goal of any investor is to construct a portfolio of positively returning negatively correlated assets. We all know that shares go up and down with greater volatility than most other asset classes so a great addition to this asset class is an investment that is positively correlated in the good times and negatively correlated in the bad times…the above chart shows that over the last 21 years, Australian bonds have more or less done that.
So whilst there are many decent arguments suggesting bonds are poor value compared to shares, they still have the potential of providing a cushion to the potential downside that the sharemarket brings to a portfolio and I believe a diversified bonds portfolio is still an important consideration for the diversified portfolio.


