

Background
Over recent years many commentators and experts have spoken of the significant risks superannuation funds are carrying with respect exposure to Australian equities. Most notable were comments a few years ago from David Murray, former Chairman of the Future Fund, and Ken Henry, former Federal Treasurer, who both said they had concerns that Australian superannuation funds were overweight Australian equities. Probably the comment I heard the most, coming from many investment professionals, was along the lines of, “balanced funds have around 60% to 70% in equities but this accounted for more than 90% of the portfolio risk”. So I thought I’d finally get around to checking out how true this statement is and if the industry as a whole has changed much over the last few years with respect to the influence of equities and their multi-asset portfolios.
Methodology
If you trust my analysis and aren’t deeply familiar or interested in quantitative methods, then save yourself some sleepy time and skip to the results. Otherwise …
There are two primary analyses undertaken, and both involve regression analysis. Instead of analysing individual diversified strategies, I have chosen the following peer group indices as they pretty much capture the market as best as I can find …
- Morningstar Australia OE Multisector Conservative (0-20% Growth Assets)
- Morningstar Australia OE Multisector Moderate (20%-40% Growth Assets)
- Morningstar Australia OE Multisector Balanced (40%-60% Growth Assets)
- Morningstar Australia OE Multisector Growth (60%-80% Growth Assets)
- Morningstar Australia OE Multisector High Growth (80%-100% Growth Assets)
These indices are also chosen as they pre-tax, thereby, producing an apples and apples comparison with the benchmarks which are also pre-tax.
The following benchmarks represent Australian equities, Global equities, and the risk-free rate …
- MSCI Australia GR AUD
- MSCI World GR AUD
- Bloomberg AusBond Bank 0+Y TR AUD
The following models were used to assess contribution to portfolio risk by equities and the portfolio exposure…
- Rp-Rf = α + β1(Ra-Rf) + ε
- Rp-Rf = α + β1(Ra-Rf) + β2(Rw-Ra) + ε
Model 1 is used to calculate exposure and contribution to total portfolio risk by Australian equities and Model 2 is used to calculate the exposure and total contribution to risk by both Australian equities and global equites.
These regression models are applied to monthly returns between 31/12/1993 and 30/4/2016…which is a long time!
The variables from the models are:
- Rp is the monthly return of peer group index
- Rf is the Risk-free rate
- α is the Alpha of the model (or beta-adjusted excess return)
- β1 is the calculated exposure to Australian equities
- Ra is the monthly return of Australian equities
- β2 is the calculated exposure to the excess return of Global equities minus Australian equities
- Rw is the monthly return of Global equities
- ε is the residual error of the model
The R-squared value of each regression equation is calculated to determine the portfolio risk that can be explained by each model and is therefore used as a proxy for “risk contribution”. The R-squared of a regression model is also known as the “goodness of fit” and its calculation (without going into too much detail) is = “Explained Variation”/”Total Variation”.
Results
Chart 1 – Australian Equity Beta
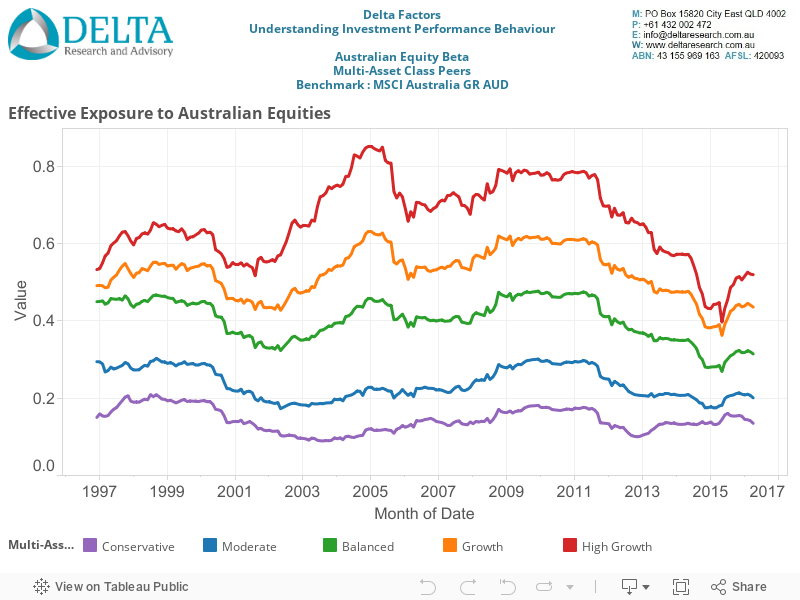
The above chart shows the Beta, or exposure, of Australian equities to each of the peer group indices. As expected, the higher the allocation to growth assets, the higher the exposure to Australian equities market. Interestingly, since late 2011 it appears the Australian equities beta has declined suggesting a lower exposure. Given the maximum growth assets for each peer groups isn’t much higher than the Australian equities beta for each peer group, you could interpret that Australian equities is the dominant asset class, and maybe it is. But, it may also suggest it is evidence of the relative high correlation between Australian equities and other growth asset classes.
Either way, these results are consistent with expectations and may somewhat support concerns around higher Australian equities allocations given their exposures or sensitivity appears to be a high proportion, but it also proof that this sensitivity to Australian equities has been in decline over the last few years or so.
Chart 2 – Australian Equity Contribution to Portfolio Risk
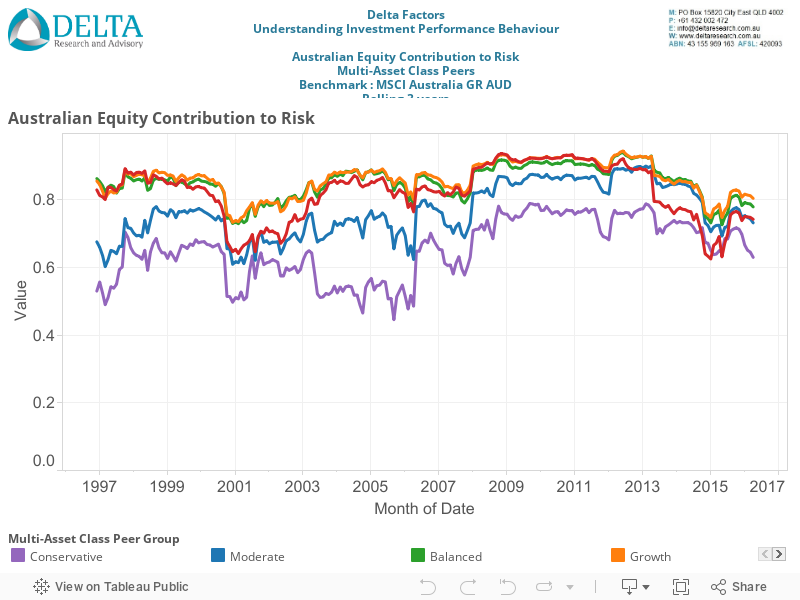
Now whilst the exposure to Australian equities appears fairly consistent with expectations; its total contribution to portfolio risk is a different story. In essence for the most part over the last 23 years (this chart starts the end of 1996 and is rolling 3 years so really starts in 1993); the Australian sharemarket contributes to a majority of risk across all multi-asset class peer groups and is therefore a very very important part of the portfolio.
Over the last few years, which is the very last point on the far right of the chart, this percentage is in the vicinity of 63% to 83% across each peer group which is somewhat consistent with the concerns spoken of Balanced funds by various experts … that is, “60% allocation to growth assets but responsible for 90% of the risk”. However, even for conservative strategies where the allocation to growth assets is less than 20%, Australian equities contributed at least two-thirds of the total portfolio risk over the last 10 years.
Chart 3 – Australian + Global Equity Contribution to Portfolio Risk
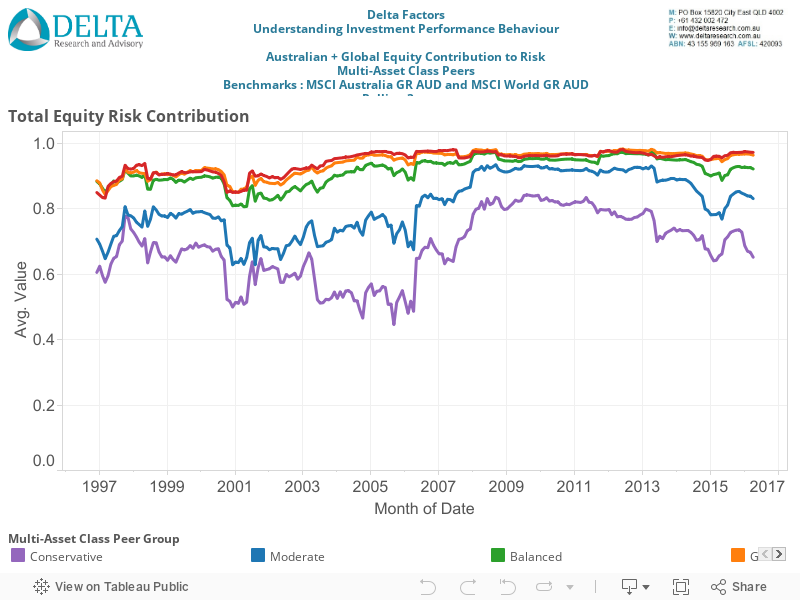
Chart 3 shows the same risk contribution statistic as Chart 2, but this time it is for Model 2, which adds the global equity market. The increase in risk contribution from both equity markets is only marginal because we are adding only the excess return by global equities over Australian equities and the two markets are fairly positively correlated so the impact of the additional asset class is small.
The more interesting results from Chart 3 include, over the last 10 to 15 years Australian Equities and Global Equities account for…
- More than 90% of the total portfolio risk across Balanced, Growth, and High Growth peers of multi-asset class strategies.
- More than 80% of the total portfolio risk for Moderate peers of multi-asset class strategies
- Between 60% and 80% of total portfolio risk for Conservative peers of multi-asset class strategies, despite no more than 20% allocated to growth asset classes!!!
So irrespective of the allocation to equities or the equities market beta, across all risk profiles, equities are clearly the dominant asset class in terms of contribution to total portfolio risk.
So What?
So when “experts” say that “equities account for 90% of total portfolio risk of a balanced fund” therefore implying there is too much exposure, it is not necessarily about too much exposure just the importance of equities. So what should investors do to reduce this reliance on equities? As we see above, only holding 20% maximum of growth assets like the conservative peer group, still produces a very high proportion of portfolio risk due to equities.
The answer is to include non-correlated assets…or in English, add assets to the investment portfolio that behave differently from equities and go up when equities go down. This reverts to Markowitz 101 and is the continued search for the holy grail of investing…including non-correlated assets to the portfolio that can reduce the risk without reducing the return expectation or increase the return without increasing the risk.
The obvious non-correlated asset over many years has been conservative highly rated bonds…which I believe was Ken Henry’s suggestion when looking to reduce the reliance on equities. Adding conservative bonds to a portfolio did reduce the contribution to risk from equities (see Charts 2 and 3 above) but as we know, adding conservative bonds is unlikely to improve the return expectations from equities and by our industry’s definition, obviously changes the risk profile. A good example of reducing equity risk are lifecycle funds. These have a moving risk profile (i.e. decreasing through time) and they gradually increase a fund’s exposure to bonds throughout time. The effect of this is to reduce the size of the volatility to combat sequencing risk leading into and through retirement, but the volatility will still be most dependent on equities.
Other potential lowly correlated considerations are alternatives, like property, private equity, infrastructure, or perhaps hedge fund strategies. There is much debate about the value of some alternatives (asset consultants and fund managers in favour of Alternatives and some big institutions are throwing in the towel, i.e. CALPERS), and if you do believe alternatives are the diversification solution, significant care must be taken to truly understand what is driving the underlying risk of these strategies. Particularly because equity markets may still be a very influential driving factor!!! Either way, if alternatives do reduce the reliance on equities in portfolio risk equation, they do so by introducing other risks … which is not necessarily a bad thing but may be. So the challenge then becomes about assessing whether those risks are adequately compensated.
Final Thoughts
The investor faces very challenging times. Interest rates both here and around the world are so low, that retired millionaires are at significant risk of running out of money. To produce higher returns still requires the acceptance of higher risks but escaping equity market risk is not at all easily achieved without significant sacrifices in costs, liquidity, or chancing the unknown. So no matter what the investor’s investment strategy or risk profile, there will most likely be a strong reliance on equities driving their success. So please note, the communication of this bigger picture concept will always be more important than the marginal advantages gained or lost from manager selection, dynamic asset allocation, security selection or whatever the latest trend is.