Source: Delta Research & Advisory, RBA, Morningstar Direct
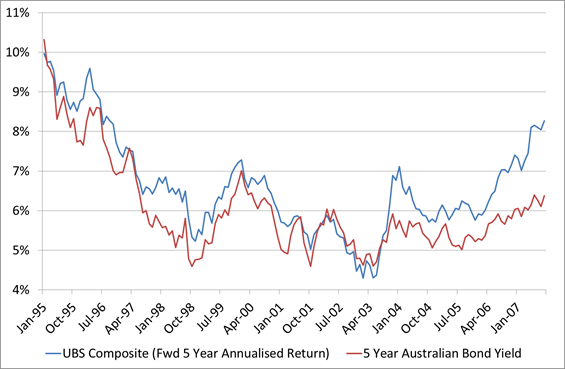
The above chart shows the forward 5 year annualised return of the UBS Composite Index and the 5 year Australian Government Bond index. The last data point in the chart is Septembr 2007 meaning the forward 5 year return is the annualised return of the UBS Composite from September 2007 to September 2012 (or last week). What it shows is quite a strong correlation between the two variables. In fact, if you run a regression between the 2 variables then the 5 year Australian Government Bond yield explaiins 82% of the variability on the 5 year return of the UBS Composite in a 1 to 1 relationship plus you can add around 0.62%pa which would explain the additional credit risk that exists in the index.
The forward return of the index obviously deviates from the bond yield over the last 4 years and this is obviously GFC related and migt be explained by the widening credit spreads. Either way, the formula of 0.62% plus the 5 Year Aust Government Bond yield appears to be quite a strong potential predictor.
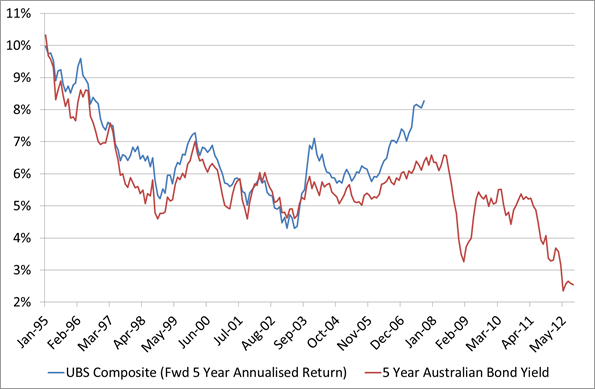
So what does the forward return expectation look like…the following chart tells the story…
Source: Delta Research & Advisory, RBA, Morningstar Direct
Using the formula calulcated, the last data point in this chart shows the 5 year Australian Government Bond Yield at approximately 2.5% plus 0.62% = 3.12%pa over the next 5 years. If you want to be a little more bullish in return expectations perhaps add another 0.5% or so thanks to the still reasonably wide credit spreads and you get a return of 3.6 – 3.8%pa over the next 5 years…lets say 4%pa…why not!
No matter which expected return you take they don’t look too attractive, and when you consider that you can currently get a 5 Year government guaranteed term deposit from a bank, credit union, or building society for well over 5%pa,(although you have to shop around) the fixed interest decision starts getting a little easier.


