Recent years has seen increased interest in infrastructure being included in investment portfolios. The justification goes that, infrastructure assets provide steady income streams linked to inflation from large, often monopoly assets (like toll roads, airports and the like), with long lifetimes that can reduce the capital volatility.
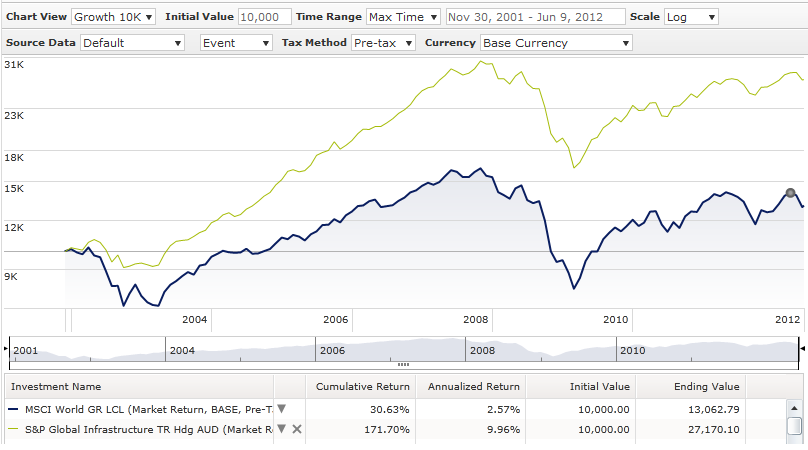
As the following ten year chart shows, global infrastructure (represented by the S&P Global Infrastructure index) has certainly outperformed global shares (represented by MSCI World GR index)…both asset classes are in Australian dollars and are unhedged to make an apples and apples comparison…but…the question is, does this past performance actually support the justification?
Source: Morningstar
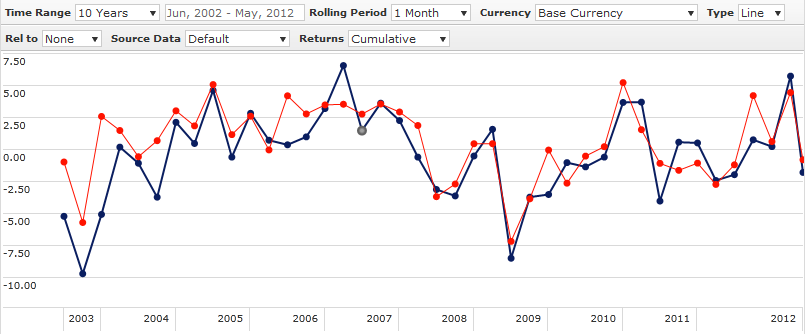
To more closely examine Global Infrastructure I created 3 risk factors that are generally accepted as providing superior sharemarket returns…i.e. the market premium (MSCI World minus UBS Bank Bill); Value Premium (MSCI World Value minus MSCI World Growth ); and Small Cap Premium (MSCI World Small Cap minus MSCI World Large Cap)…using the statistical technique, OLS Regression, i then regressed these 3 risk factors against the risk premium that Global Infrastructure has provided (S&P Global Infrastructure minus UBS Bank Bills). All analysis was done in Australian dollars effectively removing currency effects that hedging one asset class might have.
This 10 year regression analysis yielded the following results for Global Infrastructure…
- Market beta of 0.69…this means there is outperformance in bear markets but underperformance in bull markets
- A very slight value premium…significant at a ~89% confidence level
- No small or large cap bias, and
- Very slight alpha…again significant at around the 89% confidence level


