Source: RBA
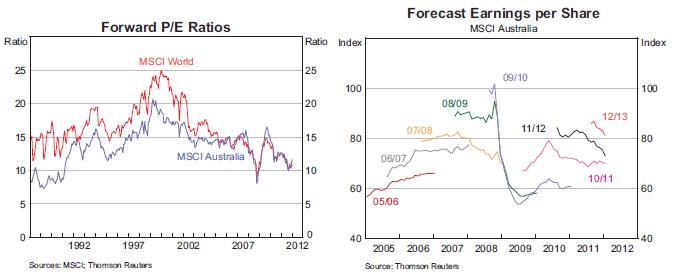
The above left chart, Forward PE Ratio, shows that the Australian sharemarket is potentially relatively cheap at the moment. The forward PE ratio, which is the ‘current price’ of the Australian sharemarket divided by forward estimates of earnings, has only been lower during the GFC and the 1990-91 recession ‘we had to have’. So on that basis alone, it appears that Australian shares may be worth buying.
However, the concerning part of that equation comes from the chart on the right, where the black line labelled 11/12 is trending sharply down. So whilst we may believe the “price” is low based on the PE ratio, the reality may be that it is “forecast earnings” are high. As forecast earnings decrease, the Forward PE Ratio will increase independent of price, and eventually may not look so attractive any more. Over the last 12 months analysts have consistenty decreased their forecast earnings for the Australian sharemarket and the current trend does look a tad worrisome.
So before you consider that a sharemarket is cheap (or hear it from a fund manager!) because the Forward PE Ratio is low, please consider whether forecast earnings are too high and likely to decrease….which is easier said than done…as the PE Ratio is a dangerous measure to be used alone.


2 pings