The biggest market in the world, often represented by the S&P 500 index, crashed pretty quickly from 24 February reaching its bottom on 23 March. This fall, in US Dollars, was around 34%. Since then, it has bounced back by around 25% after almost 5 weeks … not a bad turnaround, but obviously not back to the pre-coronavirus crisis highs yet.
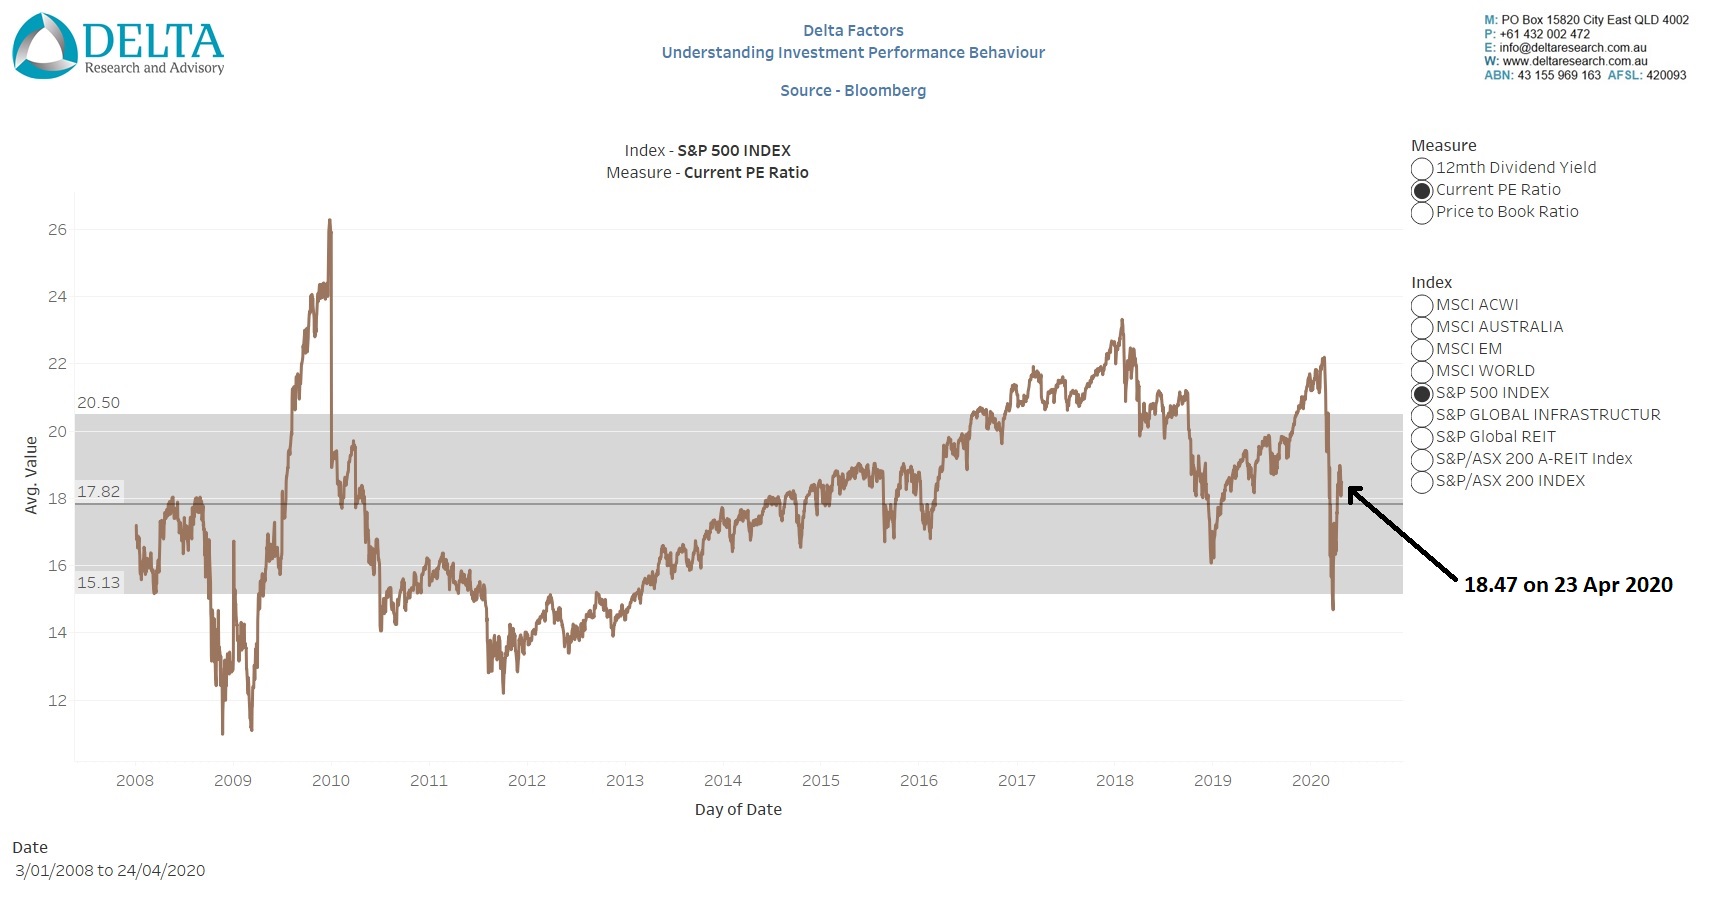
The following chart shows the current PE Ratio of the S&P 500 but going back to early 2008 which was near the start of the GFC recession.
Now, I don’t know about you, but if I thought at the start of the year that unemployment in the US was heading towards 20%, China would produce a real GDP first quarter result of negative 10%, and the global economy would effectively be shut down and likely for a fairly unknown period, I wouldn’t have thought the current PE Ratio of the S&P 500 would be above its long-term average going back to the start of 2008. (Please ntoe, this is an arbitrary start date as opposed to a data-mined start date).
The current PE Ratio of the S&P 500 represents an earnings yield of 5.4% … I’m not sure that’s particularly appealing considering the enormous expected decline in some very unknown future earnings as well as the enormous market volatility we are still likely to experience (the Vix hasn’t been below 35 since this began!) … let’s face it, the risk is high and the earnings yield isn’t that flash.
Now, of course there has been a lot of US Government stimulus (let’s be super positive for the economy and expect $3 trillion this year) and the Federal Reserve has reduced rates and is undertaking some quantitative easing. But considering this stimulus probably equates to around 10% of the valuation in the S&P 500 at the start of this crisis … its doesn’t quite add up to justify an above average PE Ratio.
So, my guess is that the market doesn’t care about valuations very much any more and/or believes there is a V-shaped recovery coming, we’ll be back to normal, and back to good growth in no time. The market appears to shrug off the prospects of a 20% unemployment figure and its long term effects and we’ll be fine in no time.
Now I know this is all probably over-simplified analysis but then I do always to reduce my error by reducing the number of variables in my calculations … but I digress!
So what should we expect from sharemarkets? I have no idea but the risks appear quite high and the rewards appear … not so high … and it doesn’t make too much sense to me.
We all get things wrong all of the time and I certainly know I am no different. The old saying that the more I know, the more I don’t know has never been truer for me than now … and it kind of sucks. There are many variables that go into these markets and market behaviour appears to be getting more complex and nuanced all of the time. So should I back this view that markets are expensive and don’t justify their current valuations? … to a degree, but I have to keep an eye on the log term, know that markets can stay irrational longer than I can stay solvent, markets are smarter than me, and …
… price momentum with news that is the opposite of my expectations is a powerful force and why I diversify.


