

Background
For quite a few years now, many commentators and researchers have criticized active strategies that charge active fees to receive benchmark-like returns. If a portfolio looks a lot like the benchmark it is trying to outperform, it doesn’t mean there won’t be outperformance, but after taking fees into consideration it is much more difficult. Taking larger position that are different from the benchmark will provide a portfolio manager with more opportunity to add alpha (risk-adjusted return) but at the same time, if those bets are wrong, then there is greater negative alpha potential too.
So, a popular portfolio construction method of many multi-manager portfolio constructors is to build portfolios of strategies which have greater idiosyncratic (or non-market) risks. The hope is to create greater alpha potential for their portfolio by avoiding the benchmark huggers, and at the same time diversify away various manager risks with the multi-manager approach. Sound reasonable? Well it does, unless you end up building the same type of portfolio you are trying to avoid.
Ultimately portfolio construction is about the efficient capture of risks we believe will add value and the avoidance of risks we believe won’t add value. Combining highly active strategies is about capturing idiosyncratic risks of an active manager in the hope positive alpha is created. What is sometimes forgotten is that market risk cannot be diversified away (except by other markets) and the diversification of strategies may diversify away the idiosyncratic risk you may be trying to capture.
Idiosyncratic Risk vs Alpha
Idiosyncratic risks are non-systematic risks of a portfolio. In the context of equities, those systematic risks include the market (e.g. S&P/ASX 200 or MSCI Australia), and perhaps various other systematic risks commonly called factors such as Value, Size, Momentum, et al.
We pay active managers the higher fees to turn idiosyncratic risk or these non-systematic bets into positive returns (otherwise known as positive alpha). But how much idiosyncratic risk is normal?
Chart 1 below breaks up total portfolio risks of all active strategies in the Australian market over the last 10 years into various systematic risks as well as idiosyncratic risk (green). It shows that over the last 10 years, the average idiosyncratic risk of all strategies (equal weighted) has been between 5% and 10% of total portfolio risk on a rolling 3 year basis with the dominant component being the market, which caters for around 85% to 90% of total portfolio risk. The other components of risk in this analysis come from a variety of factors which are important but are not the focus on this article.
Chart 1 – Portfolio Risk of Active Australian Equity Strategies

Source: Delta Research & Advisory
So the simple conclusion from this piece of analysis is that the market is easily the major component of active strategy’s total risk and this is consistent with numerous studies of long only strategies … including Brinson, Hood and Beebower (1986), who showed that more than 90% of the portfolio risk came from the asset allocation decision (or market allocation decision).
Basically, if a strategy is long only, then market risk is going to play a significant role in the portfolio outcomes and on face value, and the alpha potential comes from a much smaller component of a portfolio’s risk.
Chart 2 – CAPM Alpha vs Market Risk Contribution

Source: Delta Research & Advisory
Chart 2 shows the relationship between Idiosyncratic and Alpha for Active Australian Equity strategies over the last 5 years.
Whilst Chart 2 as a whole does appear to be a fairly random, the line on the chart is placed to show that there may be a relationship between maximum Alpha and idiosyncratic risk. Basically maximum alpha appears to diminish with decreasing idiosyncratic risk. The chart also may suggest that the lower the idiosyncratic risk, the lower the spread of Alpha, potentially supporting concerns about Benchmark huggers not producing high enough Alpha but also avoiding negative alpha, which many in the past have suggested relates to minimising career risk, but I digress.
An Experiment – with a Portfolio of Highly Active Strategies
So, to demonstrate some of the effects of building a portfolio of highly active strategies I have conducted a simple experiment.
Using the Delta Factors database of actively managed strategies, I chose five strategies that each produced positive Alpha over the last 5 years, had high levels of idiosyncratic risk (i.e. more than 15% of total portfolio risk). I would imagine this is a relatively common approach. That is, choose the strategy with the best relative performance with some basic appealing characteristics.
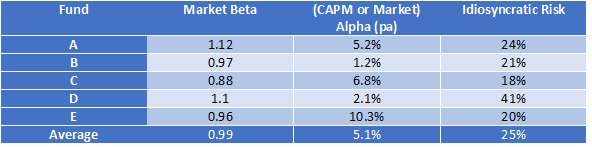
The portfolio of strategies, for the sake of simplicity and avoid accidental strategy bias, is equal weighted and rebalanced monthly (and transaction costs are ignored). Table 1 shows the basic market characteristics of five chosen funds.
Table 1 – Active Australian Equity Strategies – June 2012 to June 2017
Source: Delta Research & Advisory
These five funds, which all appear within the data from Chart1 and 2, have very impressive characteristics, insofar that historically they satisfy what we would typically want from an Australian equity portfolio. That is, they have:
- Full exposure to the Australian sharemarket … i.e. Market Beta ~1
- Strong value-add … i.e. Average Alpha ~5.1%
- Are truly active compared to peers with average Idiosyncratic Risk around 25%
This is obviously historic analysis only over the last 5 years, and we all know the past doesn’t equal the future … but it doesn’t stop of us from hoping. The construction of these highly active funds is about moving away from the benchmark huggers to produce the stronger possibility of high alpha.
So far so good.
Obviously, multi-manager portfolios comprise of more than one manager for each asset class. This is always done for diversification purposes. It may be diversification of styles, managers, or a variety of other risks. What many don’t measure or deeply understand is that a guaranteed outcome of diversification will always be the diversification of Idiosyncratic risk as you cannot diversify away market risk.
As Table 1 shows, this portfolio of active strategies has a historic average of 25% Idiosyncratic Risk. On its own that may be appealing but when they are combined into this portfolio, ignoring rebalancing transaction costs, the Idiosyncratic Risk decreases to 10% … representing a 60% reduction in the very risk we are hoping to capture! The
Now this 60% reduction in risk is specific to the portfolio, and would be lower, if fewer strategies were chosen. Either way, this portfolio of 5 strategies has created is a portfolio with significantly lower idiosyncratic risk than every single component strategy. If there is a belief that greater idiosyncratic risk is required for high Alpha, then this portfolio has significantly reduced that opportunity on a forward-looking basis. The past does not equal the future but it would be difficult to see that this is not a move towards a benchmark-like portfolio … and for highly active fees.
Conclusion
Now many might argue this is just one example and not all combinations of managers will reduce the idiosyncratic risk by this much … and that is absolutely correct. The question becomes, do you know the impacts of the risk characteristics of your multi-manager portfolio? And I would guess many would answer, “no”.
Overdiversification is a common reality in construction of multi-manager portfolios and can result in paying big bucks for more index like returns. But to manage this risk it is essential to measure it. Measuring risk contributions will help constructors ensure the desired risks are being captured more efficiently and can help reduce the effects of desired risks being diversified away. Given the growth in managed accounts across the financial planning industry and the shift towards single strategies for many clients, increased measurement of risks has never been so important for many investors.
Diversification is the only free lunch in investing. Mathematically it is due to less than perfect covariance or correlation as Harry Markowtiz’s Nobel Prize winning paper showed, but better portfolio construction is when you don’t diversify the risk you are trying to capture. That way your free lunch will hopefully taste nice.
Referenced Papers
Gary P. Brinson, L. Randolph Hood, and Gilbert L. Beebower, “Determinants of Portfolio Performance”, The Financial Analysts Journal, July/August (1986).
Markowitz, H. 1952. Portfolio Selection. The Journal of Finance 7 (1): 77–91.