

Like all economies, the Australian economy is always facing significant challenges. Since 1970 there has been the 1973 oil crisis and double digit inflation of the 1970s, the 1980-81 recession, further high inflation of the 1980s, crash of 1987, the recession we had to have in 1991, Asian crisis of 1998, global tech crash from 2000 to 2001, and of course the GFC…and I’m sure I’ve missed a few. Following the GFC, and with fair reason, investors have been told to expect low returns. Interest rates are low, so investors should expect low equity returns too. Of course, we never really know how long this is supposed to last and the wiser financial economists will rarely put a timeframe on these issues …but I digress.
The goal of this article is to set a baseline for Australian equity market return expectations using a long(ish) look at a few key measures. Now, I do realise there are very few believers that past prices can tell you something about the future…but…and you knew that but was coming…there is a somewhat remarkable consistency to the trend of equity market returns over the last 45 years as shown in Chart 1.
Chart 1
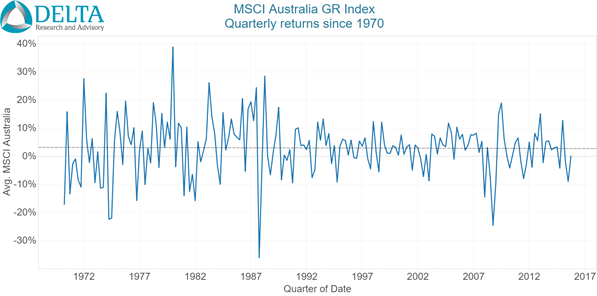
Source: MSCI, Delta Research & Advisory
Sure there is a lot of volatility but looking through all of that, since the end of 1969 (and that’s all the data I have), the trend-line through Australian equity returns is flat…that is…it is pretty much same as the average return. Now when it comes to measuring performance, in my opinion and many others, using a trend line is a superior method to simple point-to-point return analysis as it reduces starting and ending point biases. A second observation of Chart 1 and this flat return trend and maybe in spite of this trend, is that equity market volatility appears much higher during the high 1970s and 1980s then afterwards. So we have varying volatilities but a flat trend line of returns.
Now one of the numerous factors driving equity market success is the state of the economy. Chart 2 shows GDP (seasonally adjusted) over the same time period, i.e. since the end of 1969, and whilst direct correlations between equity market returns and economic growth may be weak, Chart 2 does suggest two similarities. Firstly, the trend line, like with equity markets, is flat over the 45+ year period, and once again, the 1970s and 1980s are also more volatile than the following period.
Chart 2
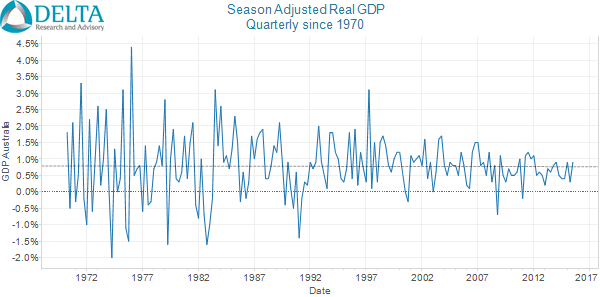
Source: ABS, Delta Research & Advisory
Now whilst GDP and equity market returns have shown flat trends (albeit with volatile volatility), there is one financial market that has changed significantly … interest rates. Chart 3 show quarterly returns of the RBA Bank Bill 90 day index since 1969 and this time there is no sign of a flat trend and little doubt the trend is down … and significantly so…but this should come as no surprise. The high inflation 1970s and 1980s resulted in high interest rates whilst over the last 25 years, has seen the lower inflation provide the Reserve Bank with scope to reduce rates to deal with the ongoing maintenance of economic growth and employment. Corresponding with this, is once again the same volatility pattern…high volatility in the 1970s and 1980s and since then…a significant reduction since.
Now when forecasting long run market returns, valuation is typically a very important factor along with many other metrics (depending on who you ask) and I don’t intend to address those here. As mentioned, the intention of this short piece is to set a baseline for expectations that can be expended and improved.
The above trend analysis suggests a real possibility that average equity market returns may continue to trend sideways …certainly 45 years (as much data as I have) isn’t a bad start. I believe the main question around what equity markets will do starts with the future trend of inflation…which means the Reserve Bank plays a key role as it’s key operating philosophy is that it believe it can contribute to Australian economic prosperity by setting the cash rate to meet an agreed inflation target.
So if inflation stays low, so too will interest rates, and déjà vu, we may continue to see what has more recently been happening. If on the other hand we experience higher inflation, interest rates will increase, which may increase equity market volatility as the denominator of valuations are placed under pressure.
Chart 3
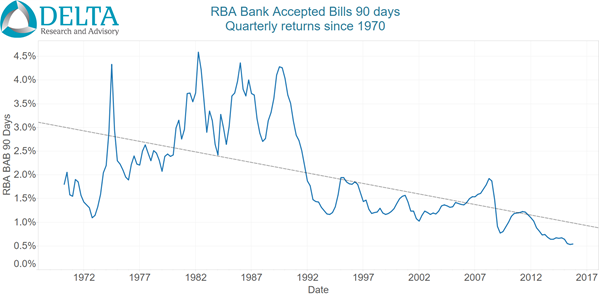
Source: RBA, Delta Research & Advisory
There is, however, one inflationary scenario not captured in the Australian economy and financial markets since 1969 and is rarely talked about; at least in the Australian context…deflation. There is definitely a complacency in the Australian economy which is probably due to the fact it has been so long since Australia actually had a technical recession. Whilst deflation is not a high probability scenario, Australia does face numerous challenges that don’t rule it out altogether. Australia’s economy is transitioning to new economic drivers; the resources investment boom is over; population is ageing; Australia has amongst the highest levels of household debt in the world; and this is accompanied by a residential property market that many argue is in a bubble in the largest markets of Sydney and Melbourne.
A severe bursting of this bubble accompanied by deflation (as seen in Japan, Spain and other burst property bubbles) would mean the above scenarios of sideways trends in equity markets and economic growth do not apply. Interest rates don’t have far to fall before reaching the zero bound and the only market mechanism left would be further weakening of the Australian dollar.
So the simple baseline scenario for long run return expectations to build from is …
- Continued contained inflation = continuation of the long run trend in equity markets and similar volatility to last 25 years + continued low interest rates
- Higher inflation = continuation of long run trend accompanied by much higher volatility then currently used to + much higher interest rates, or
- Deflation = sharp decline in the current trend accompanied by high volatility + hitting the zero interest rate bound
…or something completely unprecedented.
PS…email me if you require further proof of the above trend analysis
1 pings