

The typical approach to portfolio construction in the world of financial planning is a 2-step process (of course, this is after the desired risk and return characteristics are settled). The first step is setting asset allocation and the second is investment selection where most of the industry chooses to select from a variety of managed fund strategies.
Whilst there may be many different outcomes across the industry with respect to the asset allocation decision, estimates of return and/or risk for a variety of asset classes are considered before settling on the recommended result … whether it be designed around risk profiles, return objectives, or allocation of risk. Unfortunately it is the second step of portfolio construction. i.e. the investment selection, where a major flaw exists across the industry and the final portfolio may introduce greater risks than realised.
Part of the problem is that the 2 steps are approached in an independent way. Firstly, the asset allocation decision is a market beta decision…that means the allocation is decided according to expectation of the performance of each particular asset class over a particular time period. These performance expectations are based around benchmarks such as S&P/ASX 200, MSCI World for shares, and perhaps Bloomberg Ausbond Composite (formerly UBS Composite) and Barlcays Global Aggregate for bonds, amongst others. So if a particular asset allocation places 30% with Australian shares, then the expectation is that the final portfolio will reflect that 30% allocation.
Where the portfolio construction flaw exists, is that the investment selection may resemble nothing like the asset class it is supposed to represent. For example, within an Equities allocation there may be managers chosen that invest within the Equities asset class but take positions such that the return outcome is completely unrelated to the market the asset allocation decision is based around. Some of these strategies may be variable beta, market neutral, or with specific geographic exposures such as Emerging Markets or as extreme as India or China. Whilst there may be potential return merit in the chosen strategies because the decision is independent to the asset allocation, the investor experience may be very different than expected.
The following chart, whilst intentionally ridiculously messy, shows the 3 year rolling market beta over the last 11 years for more than 250 Australian equities managers…and they are all long only or long biased strategies. What is shows is that whilst the average beta of all strategies is 1 (you may be able to see the average line on the far left or right of the chart) and what a typical investor would expect, the variation in beta, or market exposure, of this strategy investment universe is enormous…it ranges from 0.2 to 1.8.
Market Beta (S&P/ASX 200 TR) exposure of Australian Share funds … each dot point is rolling 3 year average
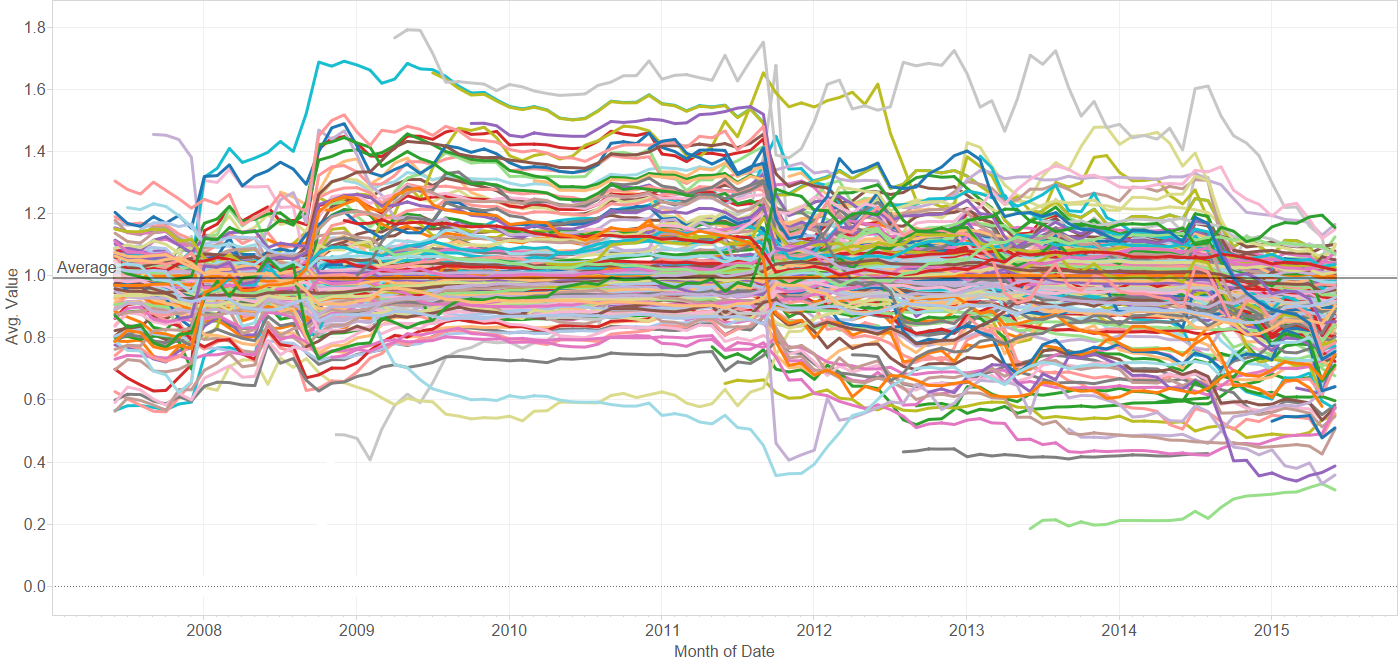
Source: Delta Research & Advisory
Believe it or not, the fund with the 1.8 beta is not a geared share fund (as would normally be the case) but is in fact a long only sector specific strategy, whilst the strategy with the 0.2 beta is a deep value long only strategy that uses cash when it doesn’t see opportunities. These types of strategies are quite frequently selected as part of an Australian shares asset allocation although their performance history suggests they are either much riskier than the market like a geared share fund (beta = 1.8) or provide very little exposure at all (beta = 0.2). So if a portfolio constructor is looking to choose investments that reflect an asset allocation these extreme strategies are very poor selections.
So what to do? To be true to an asset allocation requires consideration of the likely market beta of a strategy…and strategies with market betas consistently between 0.8 and 1.2 are possibly best as choosing strategies outside of this range increases risks of significant underperformance and heavy reliance on a strategy generating large alpha…and alpha is not always easy to come by. We know that past performance rarely equates to future performance but the same is not the case of a strategy’s beta as a very high proportion of strategies do show consistent betas (which are often mandate determined).
It is expected that many portfolio constructors, particularly the objective-driven believers, will not like or appreciate the “beta 1” approach to strategy selection and in the context of their investment philosophy that is fair enough. As mentioned above, the root cause of this portfolio construction flaw is that the asset allocation decision is independent to the investment selection decision.
So the true solution of this portfolio construction dilemma may be that there is no 2 step process to portfolio construction and the asset allocation and investment decision is performed simultaneously. Earlier in the year there was a widely held belief (and perhaps still true today) that all major asset classes are expensive. If this is the belief then beta of 1 may be a poor investment decision and movements away from market risk and towards smart beta and/or alpha potential is best. Either way, understanding the beta of the investment selection is an important part of the portfolio construction decision and one that will aid in aligning with the true desired portfolio outcomes and beliefs.